
______________________________
______________________________

Reference the article from MarketWatch.com
Reference the chart for West Texas Intermediate.
______________________________
“Technical Analysis is about probabilities.”
Note: Click on HOME for updated postings. This technical analysis is for educational purposes so you can learn to trade online using candlestick charts and other technical indicators including volume, moving averages and oscillators. Please conduct your own chart analysis or consult your financial advisor before making investment decisions. The author of this article may hold long or short positions in the featured stock or index.
© 2015 TradeOnline.ca

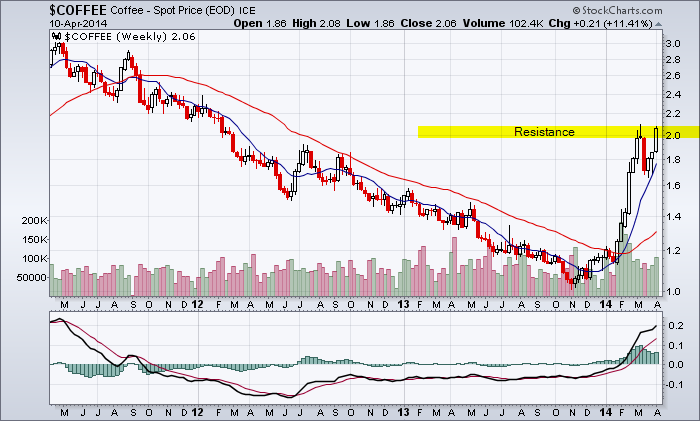
Coffee 3-Year Weekly Chart
Reference the last chart analysis for coffee.
FUND PROFILE & INFORMATION FOR JO
______________________________
“Keep it Simple”
Note: Click on HOME for updated postings. This technical analysis is for educational purposes so you can learn to trade online using candlestick charts and other technical indicators including volume, moving averages and oscillators. Please conduct your own chart analysis or consult your financial advisor before making investment decisions. The author of this article may hold long or short positions in the featured stock or index.
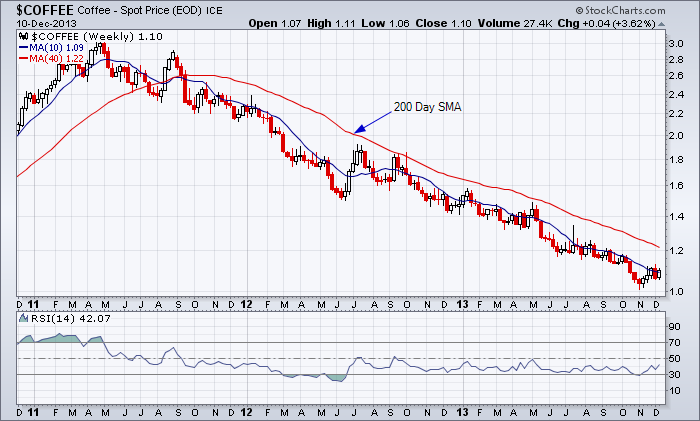
Coffee 3 Year Weekly Chart
The 200-day simple moving average is a good approximation of the major downtrend for coffee. Reference my recent chart analysis for copper for another commodity that has seen better times.
The relatively low spot price for coffee is definitely not reflected in the price of your daily caffeine fix at Tim Hortons.
Updated News Articles
Brazil Drought Jolts Coffee ETNs — February 3, 2014
______________________________
Note: Click on HOME for updated postings. This technical analysis is for educational purposes so you can learn to trade online using candlestick charts and other technical indicators including volume, moving averages and oscillators. Please conduct your own chart analysis or consult your financial advisor before making investment decisions. The author of this article may hold long or short positions in the featured stock or index.
© 2013 TradeOnline.ca