Note: Click on HOME for updated postings. This technical analysis is for educational purposes so you can learn to trade online using candlestick charts and other technical indicators including volume, moving averages and oscillators. Please conduct your own chart analysis or consult your financial advisor before making investment decisions. The chart snippets are from BigCharts.com which I recommend and have used for fifteen years. The author of this article may hold long or short positions in the featured stock or index.
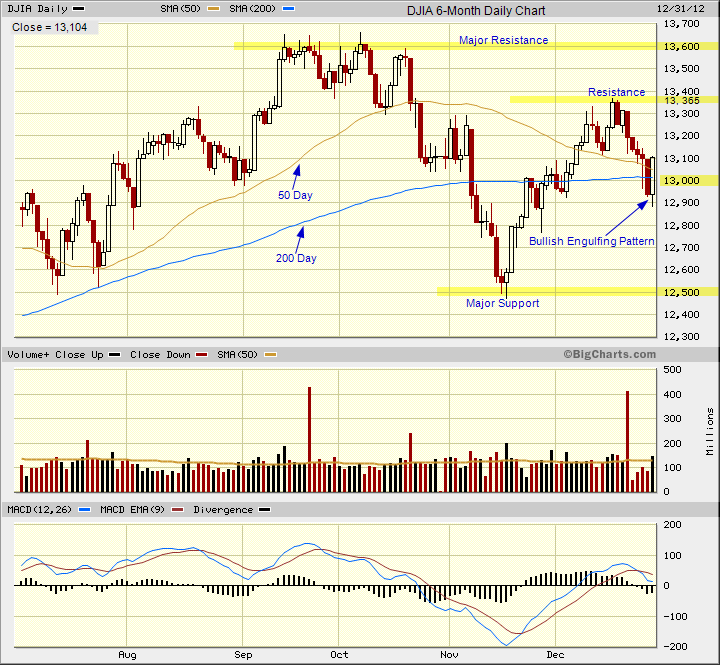
The hammer candlestick line is a reversal indicator. In this case, there is an increased probability that the six day near-term downtrend for DJIA will end. The price action for the hammer is a graphical representation of the index attempting to hold support at the 13,000 level which is also near the 200-day moving average. Follow the price action the next day which will confirm or nullify the hammer. A confirmed break below 13,000 would be a bad omen for the Dow. I use a time and percentage filter for the confirmation: 2% break that holds for two trading days. There is flexibility with this trading rule. As a matter of fact, there is flexibility with most trading rules in technical analysis.
Note: Click on HOME for updated postings. This technical analysis is for educational purposes so you can learn to trade online using candlestick charts and other technical indicators including volume, moving averages and oscillators. Please conduct your own chart analysis or consult your financial advisor before making investment decisions. The chart snippets are from BigCharts.com which I recommend and have used for fifteen years. The author of this article may hold long or short positions in the featured stock or index.
The near-term trend is up for the 10-year note which represents the movement of capital from the relative safety of the U.S. Treasury to other asset classes. The S&P 500 Index at 1,446 is above resistance levels of 1,425 and 1,440 with the financial sector being a big winner. There is hope that the U.S. will not drive over the so-called fiscal cliff as politicians do what they do best: talk with no action. But hope will not sustain the advance in stocks and the U.S. Treasury for much longer. Some sort of resolution to the fiscal mess would see the yield breakout above resistance of 1.90% and a continuation of the near-term uptrend in major U.S. stock indexes. But and there is always a but when you trade online, the major trend is still down for the U.S. Treasury and the intermediate trend is sideways.
For the TSX Index (weighted to oil and material stocks) it would take a confirmed resolution of the fiscal cliff and some good economic numbers out of China to move this Canadian index. And even this may not do the job as caution is the prevailing mood as we end 2012 and will be the prevailing mood as we enter 2013. It has been a dismal three year performance for the TSX Index relative to the U.S. Indexes.
Note: Click on HOME for updated postings. This technical analysis is for educational purposes so you can learn to trade online using candlestick charts and other technical indicators including volume, moving averages and oscillators. Please conduct your own chart analysis or consult your financial advisor before making investment decisions. The chart snippets are from BigCharts.com which I recommend and have used for fifteen years. The author of this article may hold long or short positions in the featured stock or index.
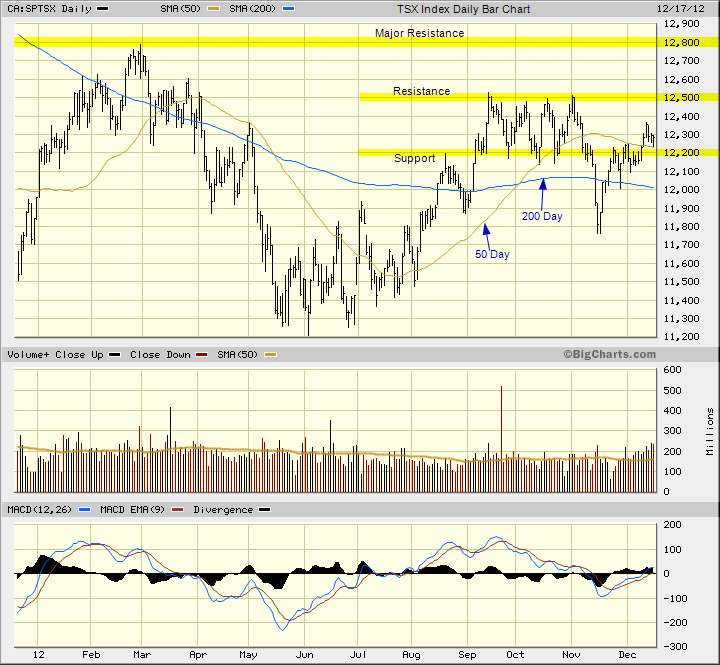
The resistance level of 12,200 identified on the last chart of the TSX Index is now the support level. The reversal of roles is an important concept in technical analysis.
Note: Click on HOME for updated postings. This technical analysis is for educational purposes so you can learn to trade online using candlestick charts and other technical indicators including volume, moving averages and oscillators. Please conduct your own chart analysis or consult your financial advisor before making investment decisions. The chart snippets are from BigCharts.com which I recommend and have used for fifteen years. The author of this article may hold long or short positions in the featured stock or index.
Candlestick chart analysis for the S&P 500 Index showing a shooting star candlestick and a hammer. This is a graphical representation of the index struggling to break resistance at the 1,425 resistance zone.
On a daily chart, you can see the 1,425 resistance zone in addition to the next near-term resistance level of 1,440.
A confirmed break above 1,440 would setup the S&P 500 Index for a test of major resistance at 1,470.
Note: Click on HOME for updated postings. This technical analysis is for educational purposes so you can learn to trade online using candlestick charts and other technical indicators including volume, moving averages and oscillators. Please conduct your own chart analysis or consult your financial advisor before making investment decisions. The chart snippets are from BigCharts.com which I recommend and have used for fifteen years. The author of this article may hold long or short positions in the featured stock or index.
Note: Click on HOME for updated postings. This technical analysis is for educational purposes so you can learn to trade online using candlestick charts and other technical indicators including volume, moving averages and oscillators. Please conduct your own chart analysis or consult your financial advisor before making investment decisions. The chart snippets are from BigCharts.com which I recommend and have used for fifteen years. The author of this article may hold long or short positions in the featured stock or index.
What can I prognosticate from the above chart? As I have said in the past, it is not a pretty picture for the TSX Index: a gain this year of 0% compared to a gain of 12% for the S&P 500 Index. And a three year gain of 6.7% for the TSX Index compared to gain of 28.9% for the S&P 500 Index.
If the TSX Index can break resistance of 12,200 then it moves into the old trading range with resistance at 12,500. A resolution of the so-called fiscal cliff would be the fundamental news to give a lift for the TSX as traders would move into some of the risk-on trades: oil and materials. But, you have the Eurozone slipping into a recession, tepid growth in the BRIC countries, Iran, and crude price differentials for Canadian producers. And these are just some of the known knowns.
The experts will give you their expert projections for the major indexes. In the end, all you can do is follow the charts when you trade online. Use tight stops on any breakout positions. And, a comfortable cash position will let you have a comfortable sleep. On Friday, the U.S.employment report will move the markets.
Note: The above chart analysis is valid as of the publication date. To review current charts click on Home or perform a search. This technical analysis is for educational purposes so you can learn to trade online using candlestick charts. Please conduct your own chart analysis or consult your financial advisor before making investment decisions. The chart snippets are from BigCharts.com which I recommend and have used for fifteen years. The author of this article may hold long or short positions in the featured stock or index.
We use cookies to ensure that we give you the best experience on our website. If you continue to use this site we will assume that you are happy with it.Ok