XEG ETF weekly chart showing major downtrend

XEG ETF 3-Year Weekly Chart
Weekly chart for XEG ETF showing the major downtrend and the failure to hold the breakout at 15. Near-term trend is down. If XEG cannot hold 14, the next support level is 13.
http://ca.ishares.com/content/en_ca/repository/resource/fact_sheet/FFS_XEG_CA46428C1005_EN_CA.PDF
______________________________
XEG ETS daily chart showing the support and resistance levels
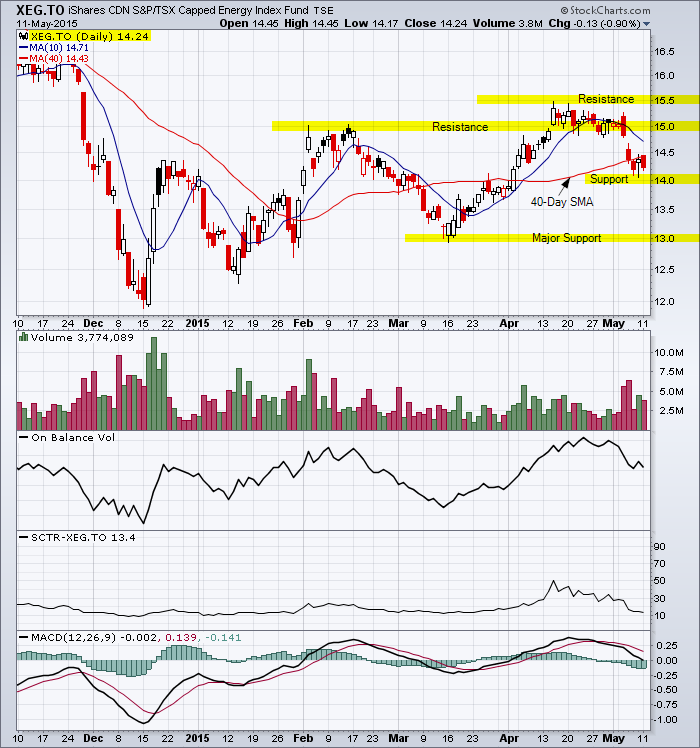
XEG ETF Daily Chart
______________________________
“Stay with the trend until it ends.”
Note: Click on HOME for updated postings. This technical analysis is for educational purposes so you can learn to trade online using candlestick charts and other technical indicators including volume, moving averages and oscillators. Please conduct your own chart analysis or consult your financial advisor before making investment decisions. The author of this article may hold long or short positions in the featured stock or index.
© 2015 TradeOnline.ca
