Another test for S&P 500 at 200-day average

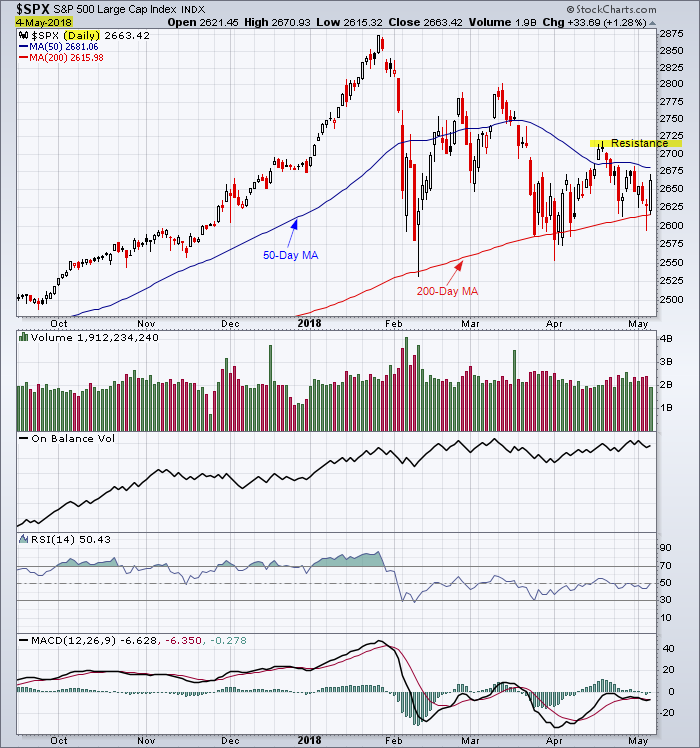
The S&P 500 is holding at the 200-day average. The near-term trend is positive and I am looking for a test near the April high of 2717. A breakout above the April high would be a positive near-term signal for the S&P 500.

S&P 500 test of the 200-day moving average.

Here is a live 4-year weekly chart for the S&P 500 Index.

Reference my last post for the S&P 500 index.

Here was my post on the sector performance.

List of S&P 500 companies

______________________________

“Technical Analysis is about putting the probabilities on your side.”
Note:This technical analysis is for educational purposes. Please conduct your own analysis or consult a financial advisor before making investment decisions. The author of this article may hold long or short positions in the featured stocks or indexes.
© 2018 TradeOnline.ca

Leave a Reply

Your email address will not be published. Required fields are marked *

This site uses Akismet to reduce spam. Learn how your comment data is processed.