The view on the weekly chart shows the index trading below the 40-week moving average. RSI and MACD are both confirming the bearish sentiment. It will test 2550 to 2600 support zone.
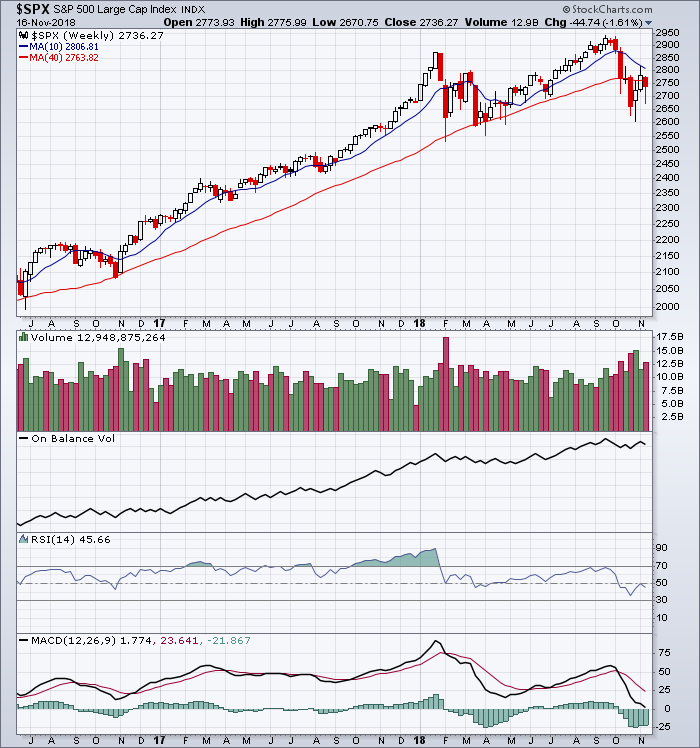
Reference a previous post as the S&P 500 was attempting to hold the 40-week moving average.
______________________________
“Technical Analysis is about identifying trends”
Note:This technical analysis is for educational purposes. Please conduct your own analysis or consult a financial advisor before making investment decisions. The author of this article may hold long or short positions in the featured stocks or indexes.
© 2018 TradeOnline.ca