Note: Click on HOME for updated postings. This technical analysis is for educational purposes so you can learn to trade online using candlestick charts and other technical indicators including volume, moving averages and oscillators. Please conduct your own chart analysis or consult your financial advisor before making investment decisions. The author of this article may hold long or short positions in the featured stock or index.
Note: Click on HOME for updated postings. This technical analysis is for educational purposes so you can learn to trade online using candlestick charts and other technical indicators including volume, moving averages and oscillators. Please conduct your own chart analysis or consult your financial advisor before making investment decisions. The author of this article may hold long or short positions in the featured stock or index.
Note: Click on HOME for updated postings. This technical analysis is for educational purposes so you can learn to trade online using candlestick charts and other technical indicators including volume, moving averages and oscillators. Please conduct your own chart analysis or consult your financial advisor before making investment decisions. The author of this article may hold long or short positions in the featured stock or index.
Need a confirmed close above the March, 2008 high of 15154
TSX Index weekly chart 2007 – 2014
The materials sector and in particular gold stocks participated in the rally today. Reference the MarketCarpet from StockCharts.com for a graphical representation of the stocks that made the move.
Note: Click on HOME for updated postings. This technical analysis is for educational purposes so you can learn to trade online using candlestick charts and other technical indicators including volume, moving averages and oscillators. Please conduct your own chart analysis or consult your financial advisor before making investment decisions. The author of this article may hold long or short positions in the featured stock or index.
Note: Click on HOME for updated postings. This technical analysis is for educational purposes so you can learn to trade online using candlestick charts and other technical indicators including volume, moving averages and oscillators. Please conduct your own chart analysis or consult your financial advisor before making investment decisions. The author of this article may hold long or short positions in the featured stock or index.
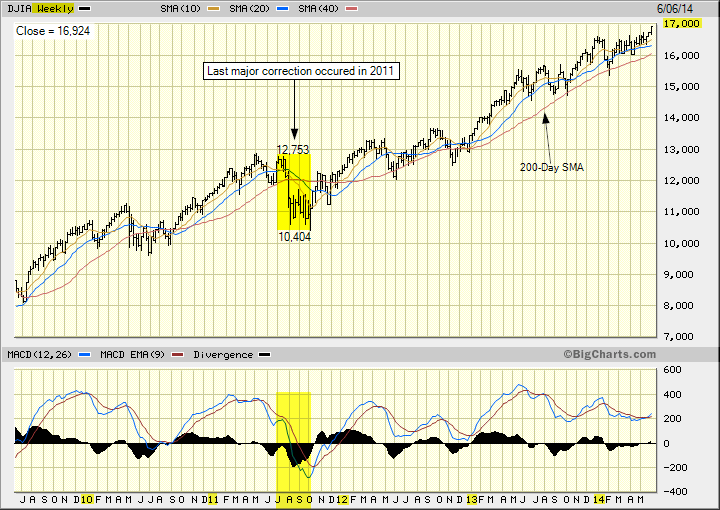
Dow Jones Industrial Average 5 Year Weekly Chart courtesy of BigCharts.com
The S&P 500 SPX +0.09% is certainly overbought, in our opinion, and has gone well beyond the time in which it typically endures a correction or worse (the 500 has advanced for 32 months without a decline of 10% or more, versus the average of 18 months since 1945). In addition, valuations on trailing and projected Operating and GAAP (also known as “As Reported”) earnings per share, are equal to their long-term averages. Read more……….
“The bulls have clearly been in the lead,” Francois Savary, who helps oversee about $9.5 billion as chief investment officer at Reyl & Cie., said by phone from Geneva. “But even with improving economic data, I think that the U.S. market may have gone too far too fast, and I don’t see too much potential from here. I would pull out of U.S. equities and go into emerging markets.” Read more…………
Note: Click on HOME for updated postings. This technical analysis is for educational purposes so you can learn to trade online using candlestick charts and other technical indicators including volume, moving averages and oscillators. Please conduct your own chart analysis or consult your financial advisor before making investment decisions. The author of this article may hold long or short positions in the featured stock or index.
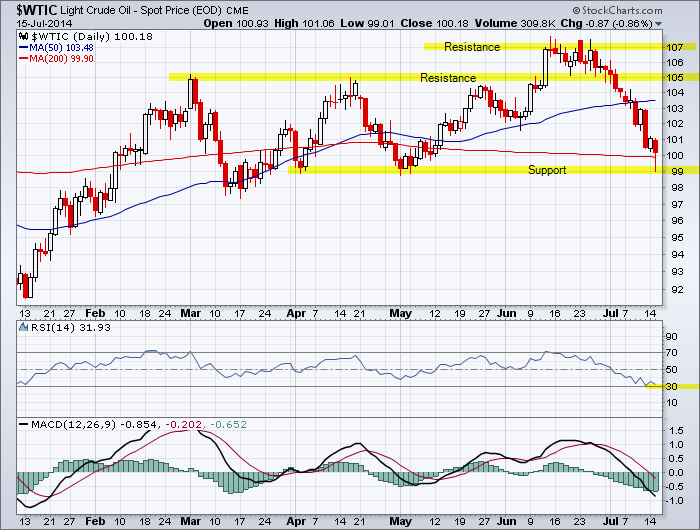
“Always trade in the direction of the major trend”
Note: Click on HOME for updated postings. This technical analysis is for educational purposes so you can learn to trade online using candlestick charts and other technical indicators including volume, moving averages and oscillators. Please conduct your own chart analysis or consult your financial advisor before making investment decisions. The author of this article may hold long or short positions in the featured stock or index.
We use cookies to ensure that we give you the best experience on our website. If you continue to use this site we will assume that you are happy with it.Ok