Author Archives: Trader

Not a good year for emerging markets

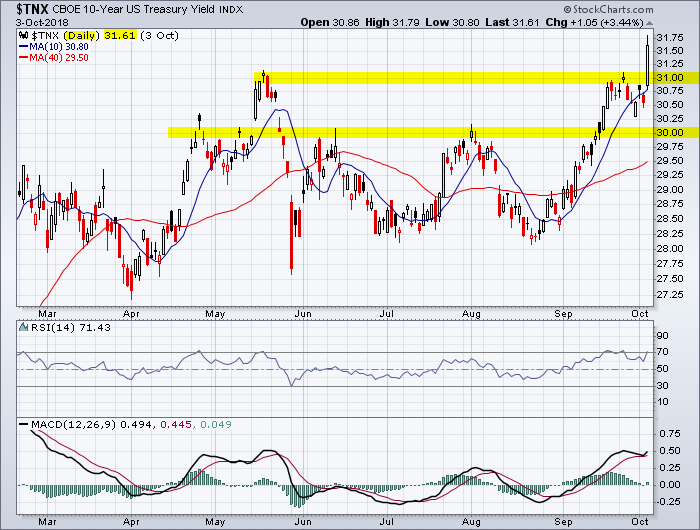
You can blame it in part on the rise in U.S. interest rates and the slowdown in China’s growth

A very bad year for emerging markets

In 1988, MSCI launched the Emerging Markets Index, which consisted of just 10 countries representing less than 1% of world market capitalization. Today the MSCI Emerging Markets Index consists of 24 countries representing 10% of world market capitalization. The Index is available for a number of regions, market segments/sizes and covers approximately 85% of the free float-adjusted market capitalization in each of the 24 countries.

https://www.msci.com/emerging-markets

______________________________

“Technical Analysis is about identifying trends”
Note:This technical analysis is for educational purposes. Please conduct your own analysis or consult a financial advisor before making investment decisions. The author of this article may hold long or short positions in the featured stocks or indexes.
© 2018 TradeOnline.ca

TSX Index YTD sector performance

TSX index sector performance

______________________________

“Technical Analysis is about identifying trends”
Note:This technical analysis is for educational purposes. Please conduct your own analysis or consult a financial advisor before making investment decisions. The author of this article may hold long or short positions in the featured stocks or indexes.
© 2018 TradeOnline.ca

S&P 500 YTD sector performance

S&P 500 sector performance

______________________________

“Technical Analysis is about identifying trends”
Note:This technical analysis is for educational purposes. Please conduct your own analysis or consult a financial advisor before making investment decisions. The author of this article may hold long or short positions in the featured stocks or indexes.
© 2018 TradeOnline.ca

S&P 500 tested major support last week at 200-day moving average

Here is the view and the setup on the weekly chart

Test at the the 200-day average on the weekly chart

______________________________

Here is the view and the setup on the daily chart

S&P 500 daily chart showing the test at the 200-day moving average.

______________________________

“Technical Analysis is about identifying trends”
Note:This technical analysis is for educational purposes. Please conduct your own analysis or consult a financial advisor before making investment decisions. The author of this article may hold long or short positions in the featured stocks or indexes.
© 2018 TradeOnline.ca

TSX Index will test major support around 15,000

Weekly chart for TSX Index showing it trading below the 200-day moving average.  A major test around 15,000 is in the cards.

______________________________

“Technical Analysis is about identifying trends”
Note:This technical analysis is for educational purposes. Please conduct your own analysis or consult a financial advisor before making investment decisions. The author of this article may hold long or short positions in the featured stocks or indexes.
© 2018 TradeOnline.ca

S&P 500 will test major support at 200-day moving average

The major uptrend as defined by the 200-day moving average still prevails until proven otherwise

______________________________

“Technical Analysis is about identifying trends”
Note:This technical analysis is for educational purposes. Please conduct your own analysis or consult a financial advisor before making investment decisions. The author of this article may hold long or short positions in the featured stocks or indexes.
© 2018 TradeOnline.ca

Ouch! Monthly average WCS discount to WTI

WCS discount to WTI

http://www.oilsandsmagazine.com/energy-statistics/oil-and-gas-prices

______________________________

“Technical Analysis is about identifying trends”
Note:This technical analysis is for educational purposes. Please conduct your own analysis or consult a financial advisor before making investment decisions. The author of this article may hold long or short positions in the featured stocks or indexes.
© 2018 TradeOnline.ca

U.S. 10-Year Treasury yield closes above 3.10%

10 year treasury surges past 3.10%

Reference the last chart analysis for the 10-Year Treasury when it broke major resistance at 3.00%

______________________________

“Technical Analysis is about enjoying the ride and knowing the exit”
Note:This technical analysis is for educational purposes. Please conduct your own analysis or consult a financial advisor before making investment decisions. The author of this article may hold long or short positions in the featured stocks or indexes.
© 2018 TradeOnline.ca