Category Archives: Other Topics

Canadian dollar daily chart

Canadian dollar will test major support at $0.7500
Intermediate downtrend for the Canadian dollar.

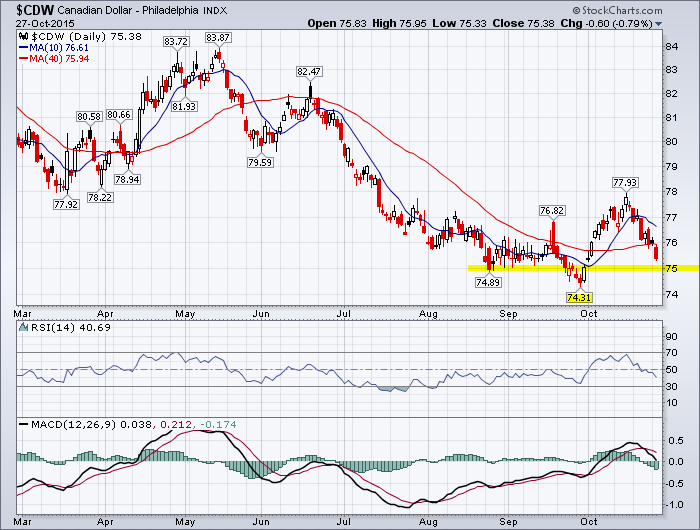
Canadian Dollar Daily Candlestick Chart

Reference the last chart analysis for the Canadian dollar.

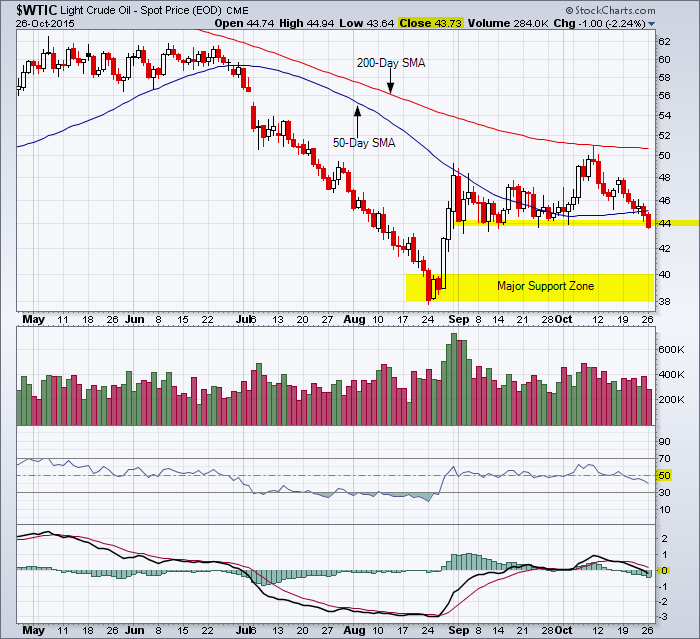
Reference the last chart analysis for the U.S. dollar.

______________________________

“Technical Analysis is about probabilities.”

Note: Click on HOME for updated postings. This technical analysis is for educational purposes so you can learn to trade online using candlestick charts and other technical indicators including volume, moving averages and oscillators. Please conduct your own chart analysis or consult your financial advisor before making investment decisions. The author of this article may hold long or short positions in the featured stock or index.

© 2015 TradeOnline.ca

Positive SSL on a transparent background

West Texas Intermediate daily chart

High probability WTI will test the major support zone
West Texas Intermediate daily chart showing the break below support of 44.

WTI 6-Month Daily chart

______________________________

“Technical Analysis is about probabilities.”

Note: Click on HOME for updated postings. This technical analysis is for educational purposes so you can learn to trade online using candlestick charts and other technical indicators including volume, moving averages and oscillators. Please conduct your own chart analysis or consult your financial advisor before making investment decisions. The author of this article may hold long or short positions in the featured stock or index.

© 2015 TradeOnline.ca

Positive SSL on a transparent background

Problems with trailer fees highlighted by new study

Mutual funds that pay trailer fees to financial advisers attract higher inflows of cash from investors even when they perform badly and tend to perform worse over all than other funds, according to critical new research commissioned by Canada’s securities regulators.

Many clients are unaware their advisers receive trailer fees from some mutual fund companies, which serve as an inducement to recommend certain funds.

Read more from this study…………………….

Chart analysis for gold

Close above the 200-day moving average for gold, but…..
Gold 6-Month Daily Chart showing close above the 200-day simple moving average

GOLD 6-Month Daily Chart

______________________________

Major and intermediate downtrend for gold
GLD ETF 5-Year chart showing the major and intermediate downtrend.

GLD ETF 5-Year Logarithmic Chart

______________________________

“Technical Analysis is about probabilities.”

Note: Click on HOME for updated postings. This technical analysis is for educational purposes so you can learn to trade online using candlestick charts and other technical indicators including volume, moving averages and oscillators. Please conduct your own chart analysis or consult your financial advisor before making investment decisions. The author of this article may hold long or short positions in the featured stock or index.

© 2015 TradeOnline.ca

Positive SSL on a transparent background

YTD performance of the major commodities

YTD performance of major commodities.

Reference the article from MarketWatch.com

Reference the chart for West Texas Intermediate.

______________________________

“Technical Analysis is about probabilities.”

Note: Click on HOME for updated postings. This technical analysis is for educational purposes so you can learn to trade online using candlestick charts and other technical indicators including volume, moving averages and oscillators. Please conduct your own chart analysis or consult your financial advisor before making investment decisions. The author of this article may hold long or short positions in the featured stock or index.

© 2015 TradeOnline.ca

Positive SSL on a transparent background

High probability WTI will not hold 45-44 support level

A break below 45-44 indicates another test at 40
Weekly chart for West Texas Intermediate showing the 45 support level

WTI 3-Year Weekly Chart

Reference the formation of the bearish descending triangle on the daily chart for WTI.

______________________________

“Technical Analysis is about probabilities.”

Note: Click on HOME for updated postings. This technical analysis is for educational purposes so you can learn to trade online using candlestick charts and other technical indicators including volume, moving averages and oscillators. Please conduct your own chart analysis or consult your financial advisor before making investment decisions. The author of this article may hold long or short positions in the featured stock or index.

© 2015 TradeOnline.ca

Positive SSL on a transparent background

West Texas Intermediate chart analysis

Bearish descending triangle forming on the daily chart
Negative descending pattern forming on the daily chart for WTI

WTI 6-Month Daily Chart

______________________________

“Technical Analysis is about probabilities.”

Note: Click on HOME for updated postings. This technical analysis is for educational purposes so you can learn to trade online using candlestick charts and other technical indicators including volume, moving averages and oscillators. Please conduct your own chart analysis or consult your financial advisor before making investment decisions. The author of this article may hold long or short positions in the featured stock or index.

© 2015 TradeOnline.ca

Positive SSL on a transparent background

Shanghai Index weekly chart

The key support level is 3500
Key support for the Shanghai Index is 3500

Shanghai Index 2-Year Chart

Reference the last chart analysis for the Shanghai Index.

______________________________

“Stay with the trend until it ends.”

Note: Click on HOME for updated postings. This technical analysis is for educational purposes so you can learn to trade online using candlestick charts and other technical indicators including volume, moving averages and oscillators. Please conduct your own chart analysis or consult your financial advisor before making investment decisions. The author of this article may hold long or short positions in the featured stock or index.

© 2015 TradeOnline.ca

Positive SSL on a transparent background