Near-term uptrend with resistance at $3.40
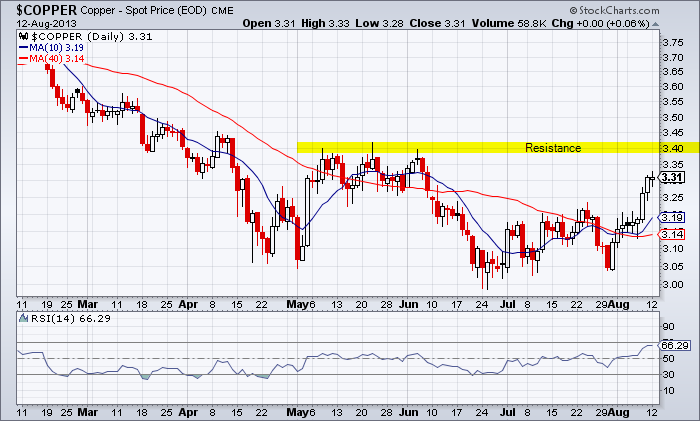
Copper Daily Chart courtesy of StockCharts.com
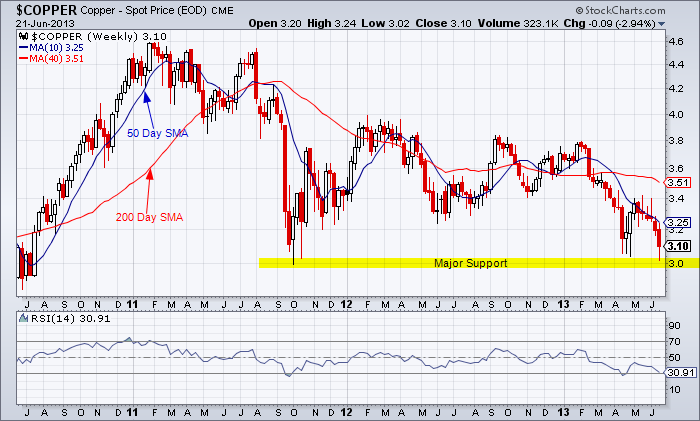
Reference the last chart analysis for copper.
______________________________
Note: Click on HOME for updated postings. This technical analysis is for educational purposes so you can learn to trade online using candlestick charts and other technical indicators including volume, moving averages and oscillators. Please conduct your own chart analysis or consult your financial advisor before making investment decisions. The author of this article may hold long or short positions in the featured stock or index.
© 2013 TradeOnline.ca