Category Archives: TSX Index

TSX Index candlestick chart analysis

TSX Index must hold support zone or it will test 11,800
TSX Index in a near-term downtrend and must hold the support zone or it will test 11,800.

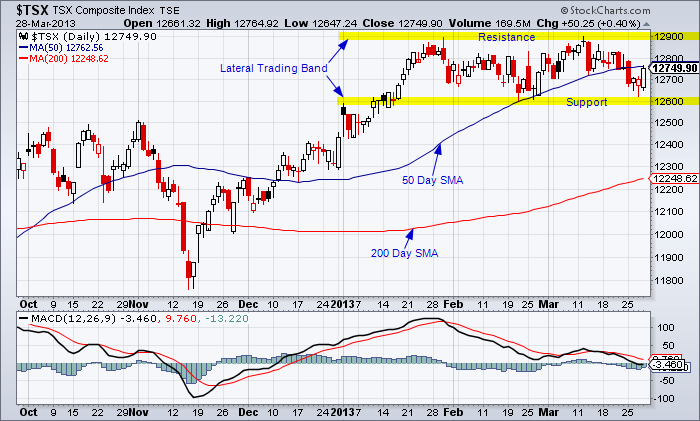
TSX Index Daily Candlestick Chart

The last chart analysis for the TSX Index showed it stuck in a lateral trading band with support at 12,600 and resistance at 12,900. That all ended on Wednesday in a big way when the tall dark candlestick crashed through two support levels: 12,600 and 12,500. The trading action today confirmed the near-term downtrend with an open and close below the close for the ominous tall dark candlestick.

The TSX Index now has a new major resistance level of 12,500 (reversal of roles) which was a prior major support level.

The support zone is based on three points:

  1. A 50% retracement of the November intermediate move which would be 12,350
  2. The 200 day moving average at 12,269
  3. The old support level of 12,200

If the TSX Index cannot hold the support zone, there is a high probability of a test of the November low around 11,800.

If you read my previous posts, this surprise drop on Wednesday should come as no surprise. Material and oil related stocks, which represent 45% of the TSX Index, have performed very poorly. Reference a recent post on Dr. Copper.

U.S. Jobs Report will move the market on Friday: most likely to the downside.

______________________________

Note: Click on HOME for updated postings. This technical analysis is for educational purposes so you can learn to trade online using candlestick charts and other technical indicators including volume, moving averages and oscillators. Please conduct your own chart analysis or consult your financial advisor before making investment decisions. The author of this article may hold long or short positions in the featured stock or index.

© 2013 TradeOnline.ca

TSX Index candlestick chart anaysis

TSX Index stuck in a lateral trading range
TSX Index intermediate lateral trading range with resistance at 12,900

TSX Index daily candlestick chart

Reference the last chart analysis for the TSX Index: not much has changed.

______________________________

Note: Click on HOME for updated postings. This technical analysis is for educational purposes so you can learn to trade online using candlestick charts and other technical indicators including volume, moving averages and oscillators. Please conduct your own chart analysis or consult your financial advisor before making investment decisions. The author of this article may hold long or short positions in the featured stock or index.

© 2013 TradeOnline.ca

TSX Index daily stock chart

Near-term uptrend for the TSX Index with resistance at 12,895
TSX index stock chart analysis showing support and resistance levels

TSX Index Daily Chart

The intermediate trend is sideways and the near-term trend is up.

Reference the last chart analysis for the TSX Index.

Reference a recent chart for copper highlighting the correlation with the TSX Index.

______________________________

Note: Click on HOME for updated postings. This technical analysis is for educational purposes so you can learn to trade online using candlestick charts and other technical indicators including volume, moving averages and oscillators. Please conduct your own chart analysis or consult your financial advisor before making investment decisions. The author of this article may hold long or short positions in the featured stock or index.

© 2013 TradeOnline.ca

XMA – S&P/TSX Capped Materials Index Fund

XMA is testing major support at $16.00
Candlestick chart of XMA - S&P/TSX Capped Materials Index Fund  showing the major downtrend with support at $16.00 courtesy of <a href=

XMA 5-Year Candlestick Chart courtesy of BigCharts.com


Reference the last chart analysis for the TSX Index.

Reference the last chart analysis for XEG – S&P/TSX Capped Energy Index Fund.

Reference iShares XMA – S&P/TSX Capped Materials Index Fund overview.

______________________________

Note: Click on HOME for updated postings. This technical analysis is for educational purposes so you can learn to trade online using candlestick charts and other technical indicators including volume, moving averages and oscillators. Please conduct your own chart analysis or consult your financial advisor before making investment decisions. The author of this article may hold long or short positions in the featured stock or index.

© 2013 TradeOnline.ca

TSX Composite Index chart analysis

TSX Index could test support of 12,500
TSX index weekly chart showing support and resistance levels

TSX Index 3-Year Weekly Chart courtesy of BigCharts.com

The intermediate trend is up for the TSX Index and the near-term trend is down. Resistance is located around the 12,800 level with support at 12,500. The energy and materials sectors, representing 45% of the TSX Index, are struggling and there is an increased probability that the TSX will test support at 12,500.

Reference the last chart analysis for the TSX Index.

Relevant articles picked from the Web:

______________________________

Note: Click on HOME for updated postings. This technical analysis is for educational purposes so you can learn to trade online using candlestick charts and other technical indicators including volume, moving averages and oscillators. Please conduct your own chart analysis or consult your financial advisor before making investment decisions. The author of this article may hold long or short positions in the featured stock or index.

© 2013 TradeOnline.ca

TSX Index struggling at resistance zone of 12,800

Due to the underperforming energy and materials sectors
TSX Index three year candlestick chart showing the index struggling at the resistance zone of 12,800.

TSX Index 3-Year Weekly Chart courtesy of BigCharts.com

Reference the last chart analysis for the TSX Composite Index.

Reference the chart analysis for XEG – S&P/TSX Capped Energy Index Fund.

Reference the chart analysis comparing the performance of the U.S. and Canadian energy sectors.

Reference the chart analysis for the divergence of the Canadian dollar and the TSX Composite Index.

______________________________

Note: Click on HOME for updated postings. This technical analysis is for educational purposes so you can learn to trade online using candlestick charts and other technical indicators including volume, moving averages and oscillators. Please conduct your own chart analysis or consult your financial advisor before making investment decisions. The author of this article may hold long or short positions in the featured stock or index.

© 2013 TradeOnline.ca

Canadian Dollar and TSX Composite Index Diverge

Negative implications for the TSX Index
A one year line chart for the Canadian Dollar and the TSX Index showing the divergence starting In January, 2013.  The correlation coefficient is plotted on the lower part of the chart.

Canadian Dollar and TSX Index 1-Year Line Chart courtesy of StockCharts.com

In the above line chart, I am plotting the one year daily performance of the S&P/TSX Composite Index with an overlay (blue line) of the one year performance of CurrencyShares Canadian Dollar Trust ETF (ticker:FXC).

The S&P/TSX Index is trading in an intermediate uptrend and is attempting to hold above the 12,800 support level. The Canadian dollar ETF is in a near-term downtrend with a break below the support level of $99.00 which was the November, 2012 reaction low. From a visual inspection of the above chart, it is evident that the two normally trade together as confirmed by the correlation coefficient at the bottom of the chart. The January, 2013 negative divergence is easily identified on the chart.

If the positive correlation between the TSX Index and the Canadian dollar is still relevant, then either the TSX trades down or the Canadian dollar trades up.  At this stage in the market, I do not forecast an uptrend for the dollar so one can conclude that the TSX Index will not advance much more is this intermediate uptrend. The Canadian dollar has lost some of its luster as a petro-currency and safe haven investment.

Referenced the last chart analysis for the S&P/TSX Composite Index.

______________________________

Note: Click on HOME for updated postings. This technical analysis is for educational purposes so you can learn to trade online using candlestick charts and other technical indicators including volume, moving averages and oscillators. Please conduct your own chart analysis or consult your financial advisor before making investment decisions. The author of this article may hold long or short positions in the featured stock or index.

© 2013 TradeOnline.ca

TSX Composite Index chart analysis

TSX Index intermediate uptrend and resistance levels
Chart analysis for the TSX Composite Index showing the intermediate uptrend  with resistance levels. RSI and volume are confirming the uptrend.

TSX Composite Index Weekly Chart

The 12,800 level near the February, 2012 intraday high of 12,788 has been a significant support and resistance level back to June, 2011 when it acted as support. Then it was a resistance level in September, 2011. The reversals of roles in an important concept in technical analysis. I  want to see a confirmed close around 12,900 that holds for two days before the 12,800 price zone is declared a new support level.

The TSX Composite Index has the momentum to breakout above near-term resistance of 12,788 which was the February, 2012 intraday high. But; the materials and oil sectors, which have a 45% weighting in the index, are not participating in the advance. These two sector will have to move upward to sustain the intermediate uptrend in the TSX Index to the 13,500 resistance level. And for these two sectors to move, the underlying commodities have to move upward. But, there is no intermediate uptrend for gold, silver, copper, or oil. And, then there is the frustrating Canadian crude differential partly due to pipeline constraints. And, then there is the low North American price for natural gas.

Reference the last chart analysis for the TSX Index posted on January 10, 2013.

Relevant articles picked from the Web:

______________________________

Note: Click on HOME for updated postings. This technical analysis is for educational purposes so you can learn to trade online using candlestick charts and other technical indicators including volume, moving averages and oscillators. Please conduct your own chart analysis or consult your financial advisor before making investment decisions. The chart snippets are from BigCharts.com which I recommend and have used for fifteen years. The author of this article may hold long or short positions in the featured stock or index.

© 2013 TradeOnline.ca