Published June 24, 2026
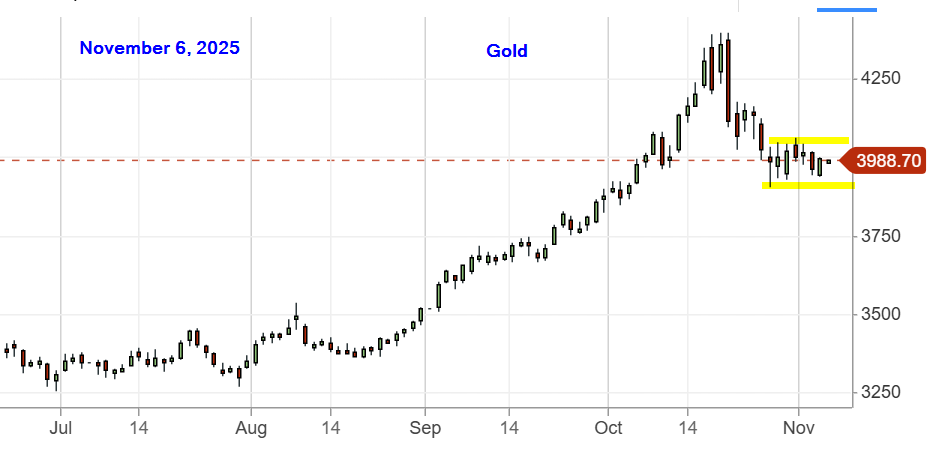
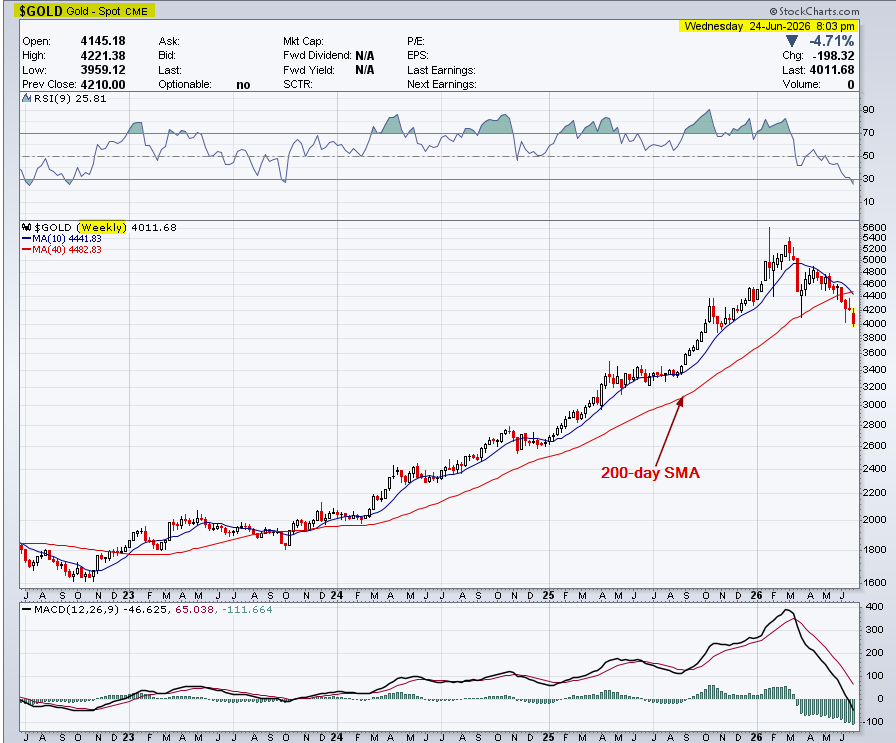
Analysis: The major trend is up, the intermediate trend is down, and the near-term trend is down. Gold is down about 25% from the March high. The 50-day moving average is about to cross below the 200-day moving average which is called the death cross. The key support level is $4000. After that, the next support level is around $3400. On the positive side, the RSI indicator is oversold and MACD is oversold which could indicate a bounce off $4000 support level. The fundamental reason for the downtrend is the uptrend in the U.S. Dollar (USD) which is experiencing a period of renewed strength, driven largely by shifting expectations regarding Federal Reserve monetary policy and resilient economic indicators. Gold trades inversely to the U.S. Dollar.
_____________
Technical Analysis is about trading with the trend
Note: This technical analysis is for educational purposes. Please conduct your own analysis or consult a financial advisor before making investment decisions. The author of this article may hold long or short positions in the featured stocks or indexes. The article was written with the help of AI and was reviewed by an editor.
© 2026 TradeOnline.ca InvestOnline.ca ChartAnalysis.ca