His first year back in office was the most profitable of his life, bestowing US$3-billion in wealth on the family fortune, according to Forbes.
Mr. Trump’s self-enrichment campaign comes at a cost to us all. It rips off those on the other side of those trades. And it undermines the fairness of the public markets.
In March, more than US$800-million worth of oil futures changed hands just minutes before Mr. Trump announced on Truth Social that strikes on Iran’s infrastructure would be postponed, according to the Wall Street Journal.
Same thing a couple weeks ago, as detailed by the influential market commentator The Kobeissi Letter. In the early hours of May 6, someone bet nearly US$1-billion on crude oil shorts, which pay off if the price of oil drops. About an hour later, Axios reported that a deal to end the war in Iran was in the works. Oil prices quickly dove by 12 per cent, and those shorts netted a cool US$125-million.
The 2008 oil price spike, which saw West Texas Intermediate (WTI) crude hit an all-time record of $147.27 per barrel in July, was a “perfect storm” of economic, geopolitical, and financial factors. It wasn’t caused by a single event, but rather a collision of supply and demand that many at the time called the “Third Oil Shock.”
Here is the breakdown of what drove prices into the stratosphere:
1. The “Demand Shock” (Emerging Giants)
The single biggest driver was the rapid industrialization of China and India.
The Awakening: These two nations were growing at nearly 10% GDP, shifting millions of people into the middle class who were buying cars and using electricity for the first time.
Inelasticity: Global demand was growing so fast that it didn’t matter if prices went up; these emerging economies needed the fuel to keep their factories running, creating a “bidding war” for every available barrel.
2. Stagnant Global Supply
While demand was skyrocketing, the world’s ability to pump more oil had hit a wall.
Spare Capacity: Historically, Saudi Arabia kept enough “spare capacity” to flood the market if prices got too high. By 2008, that cushion had dwindled to almost nothing.
Non-OPEC Struggles: Production in places like the North Sea and Mexico was in natural decline, and new projects (like deep-water drilling) were taking years longer than expected to come online.
Peak Oil Fears: This was the era where the “Peak Oil” theory went mainstream—the fear that the world had already reached its maximum physical production limit.
3. Geopolitical Risk Premium
Investors added a “fear tax” to the price of oil due to constant instability in key producing regions:
The Middle East: Continued fallout from the Iraq War and rising tensions with Iran over its nuclear program led to fears of a closure of the Strait of Hormuz.
Nigeria: Militant attacks on pipelines in the Niger Delta frequently knocked hundreds of thousands of barrels per day offline.
Venezuela: Political friction between the U.S. and Hugo Chávez’s government led to concerns about supply reliability from one of the U.S.’s biggest providers.
4. The Weakening U.S. Dollar
Oil is priced globally in U.S. Dollars ($USD$). In 2008, the dollar was losing value rapidly against the Euro and other currencies.
The Hedge: When the dollar weakens, oil prices usually rise to compensate.
Foreign Buyers: For a buyer in Europe using Euros, oil didn’t actually feel as “expensive” as it did to an American, because their currency was stronger. This kept global demand high even as prices in dollars soared.
5. Financial Speculation (“The Bubble”)
This is the most debated cause. Many analysts believe the “financialization” of commodities played a role.
Index Funds: Huge amounts of pension fund and hedge fund money flowed into “commodity index funds.” These investors weren’t buying oil to use it; they were buying it as a financial asset.
The Momentum: This created a feedback loop—as prices rose, more speculative money flowed in, pushing prices even higher until the bubble finally burst during the Great Financial Crisis later that year.
Comparison: 2008 vs. Today
Factor
2008 Peak ($147)
2026 Context
Main Driver
China’s Industrialization
Geopolitical Conflict (ME/Ukraine)
Supply
Physical Scarcity Fears
Sufficient Supply (Shale/OPEC+)
US Dollar
Record Weakness
Generally Stronger
Demand
Rapidly Rising
Transitioning (EVs/Renewables)
The spike ended abruptly in late 2008 when the global financial system collapsed. Demand vanished almost overnight, and oil plummeted from $147 to under $40 in just six months—one of the most violent “price destructions” in history.
Considering the recent spikes we’ve seen in WTI and HOU.TO, do you think today’s geopolitical tensions are creating a similar “fear premium” to what we saw in 2008?
_____________
Technical Analysis is about trading with the trend
Note: This technical analysis is for educational purposes. Please conduct your own analysis or consult a financial advisor before making investment decisions. The author of this article may hold long or short positions in the featured stocks or indexes. The article was written with the help of AI and was reviewed by an editor.
Analysis: This was published in WSJ today. It is worth the read.
While traditional energy investors spent the past weekend counting down the minutes until futures markets reopened on Sunday, overseas crypto traders were already placing their bets on the direction of oil prices.
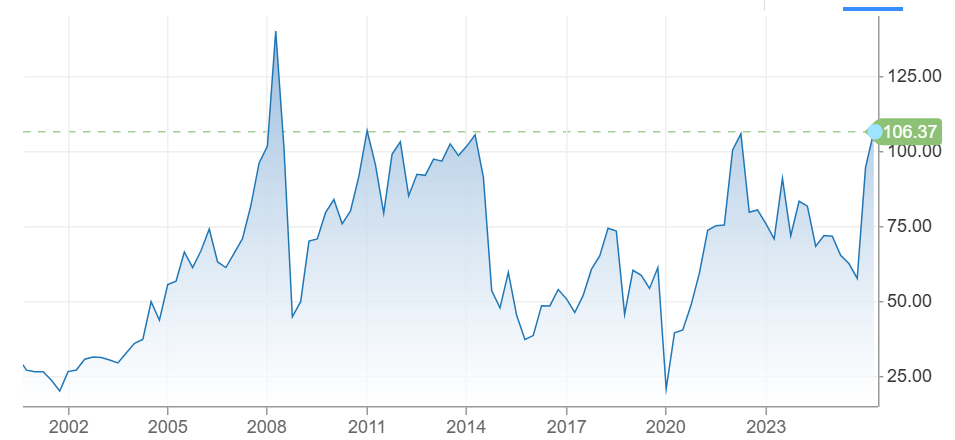
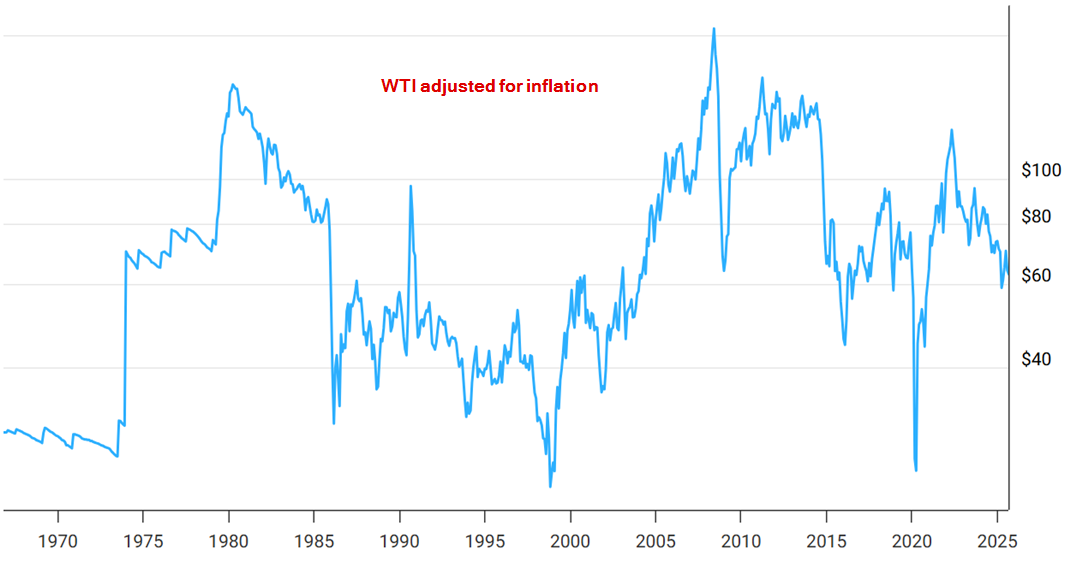
As of January 2, 2026, the price of WTI Crude Oil is approximately $57.50 USD per barrel. The price of oil shown in the chart is adjusted for inflation using the headline CPI and is shown by default on a logarithmic scale.
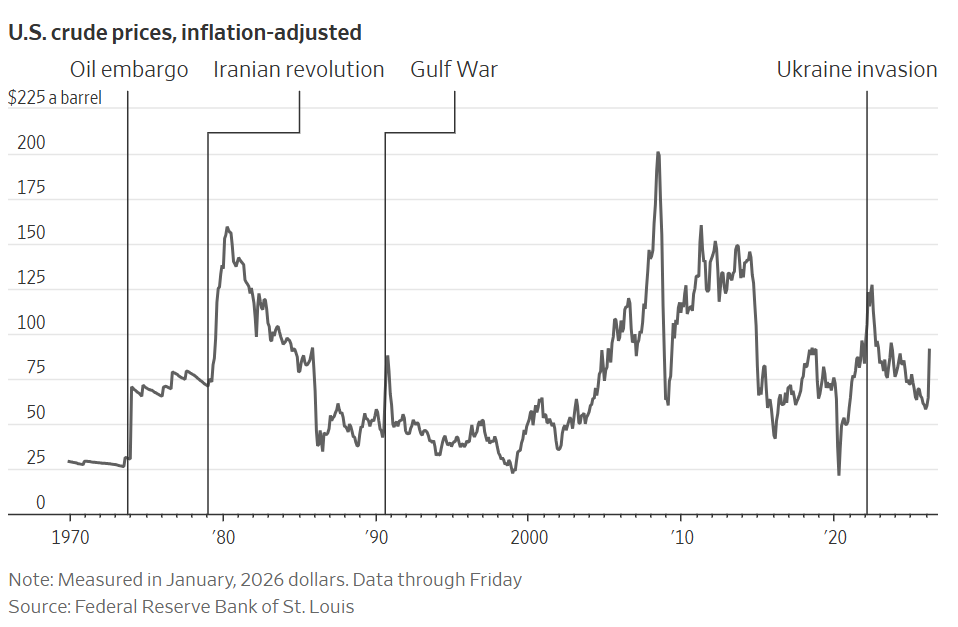
1. The Era of Cheap Oil (1968–1972)
Before the formation of OPEC as a political force, oil prices were remarkably stable and controlled largely by the “Seven Sisters” (major US/European oil companies).
1968 Price:~$3.00
Context: Oil was abundant and cheap. The US was the world’s swing producer, and prices rarely moved more than a few cents.
2. The Oil Shocks (1973–1985)
Everything changed in the 1970s when control of pricing shifted from Western companies to Middle Eastern nations.
1973 (The First Shock): Prices tripled from $4 to $12 following the Arab Oil Embargo (Yom Kippur War).
1979 (The Second Shock): Prices doubled from $15 to $39.50 following the Iranian Revolution.
1980 Peak: Reached an inflation-adjusted high that wouldn’t be beaten until 2008.
3. The Great Collapse & The “Lost Decade” (1986–1999)
A massive oversupply (the “Glut”) caused prices to crash, leading to a long era of cheap energy.1
1986 Crash: Saudi Arabia tired of cutting production and flooded the market.2 Prices collapsed from $30 to $10 in roughly four months.
1990 Spike: Briefly hit $40 during the Gulf War (Iraq/Kuwait) but quickly fell back.3
1998 Low: The Asian Financial Crisis crushed demand, sending oil down to $11.90 per barrel.
4. The “Supercycle” (2000–2014)
Driven by the industrialization of China and India, demand exploded.4
2000-2007: steady climb from $25 to $90.
2008 Peak: WTI hit its all-time record of $147.27 in July 2008.
2008 Crash: The Global Financial Crisis sent it crashing down to $33 by December.
2011–2014: The “Hundred Dollar Era.” Prices stabilized over $100 for nearly three years due to the Arab Spring.
5. The Shale Revolution & COVID (2015–2021)
US Fracking technology flooded the market with new supply, breaking OPEC’s grip.
2014 Crash: Prices fell from $107 to $50 as OPEC refused to cut production to fight US shale.5
2020 (The Anomaly): During the pandemic lockdowns, demand vanished. On April 20, 2020, WTI futures briefly traded at negative -$37.63 (traders paid people to take the oil).
6. The War & The Correction (2022–2026)
2022 High: Russia’s invasion of Ukraine sent prices back to $123.
2023–2024: Prices slowly ground lower as interest rates rose and US production hit record highs.
Late 2025/Early 2026: Prices have softened significantly to the $57–$60 range due to fears of oversupply and weak demand from China.6
Technical Analysis is about trading with the trend
Note: This technical analysis is for educational purposes. Please conduct your own analysis or consult a financial advisor before making investment decisions. The author of this article may hold long or short positions in the featured stocks or indexes.
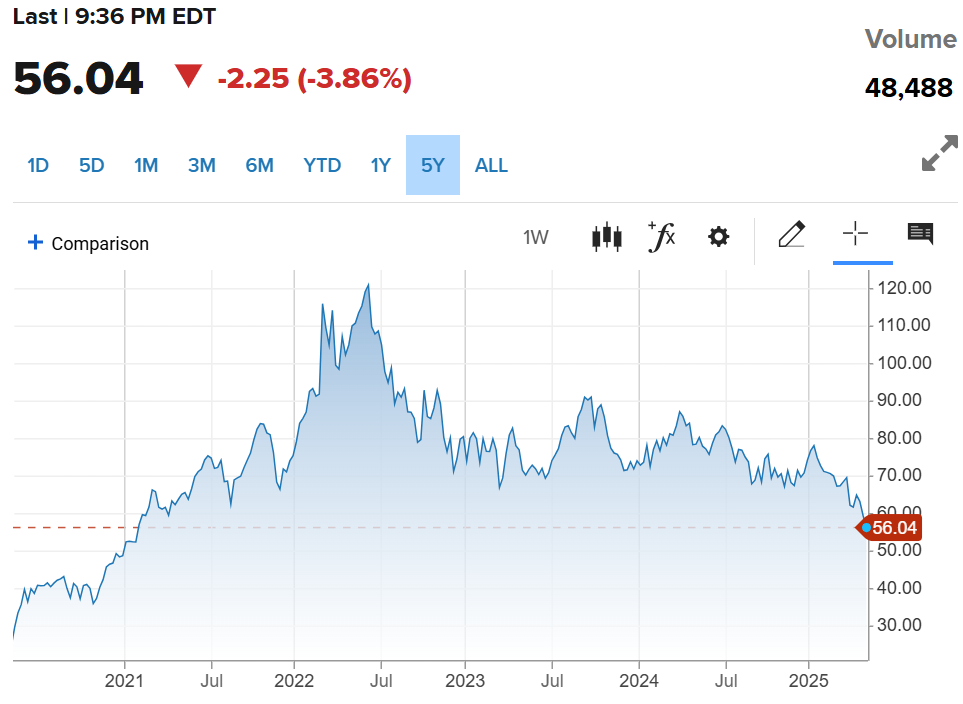
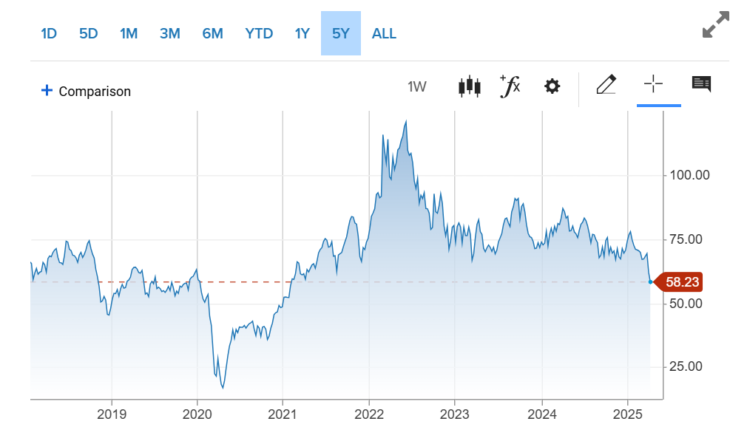
At this stage, WTI is in full sell mode as depicted on the long-term chart.
_____________
Technical Analysis is about trading with the trend
Note: This technical analysis is for educational purposes. Please conduct your own analysis or consult a financial advisor before making investment decisions. The author of this article may hold long or short positions in the featured stocks or indexes.
We use cookies to ensure that we give you the best experience on our website. If you continue to use this site we will assume that you are happy with it.