Major trend is up, intermediate trend is up and near-term trend is up for the TSX Index
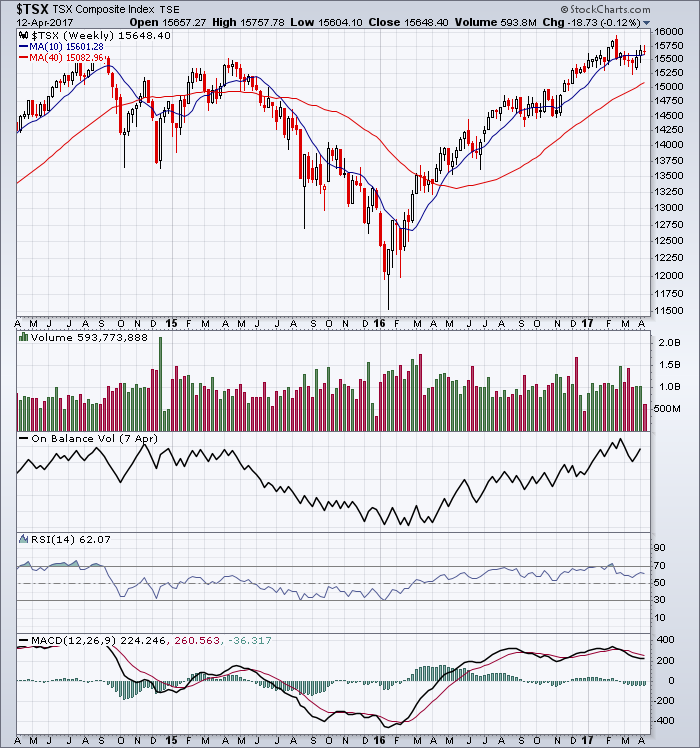
Reference the last chart analysis for the TSX Index showing the percent of stocks above the 50-day moving average.
Market News: TSX falls; BlackBerry jumps to 1-year high on arbitration win
______________________________
“Technical Analysis is about putting the probabilities on your side.”
Note: This technical analysis is for educational purposes so you can learn to trade online using candlestick charts and other technical indicators including volume, moving averages and oscillators. Please conduct your own chart analysis or consult your financial advisor before making investment decisions. The author of this article may hold long or short positions in the featured stock or index.
© 2017 TradeOnline.ca