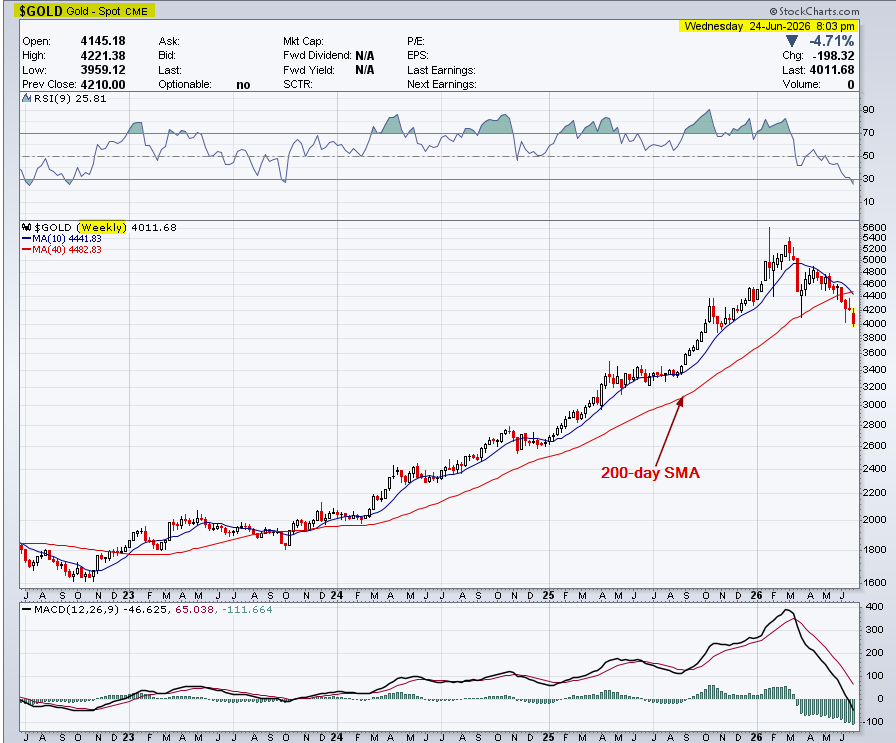
Analysis: The major trend is up, the intermediate trend is down, and the near-term trend is down. Gold is down about 25% from the March high. The 50-day moving average is about to cross below the 200-day moving average which is called the death cross. The key support level is $4000. After that, the next support level is around $3400. On the positive side, the RSI indicator is oversold and MACD is oversold which could indicate a bounce off $4000 support level. The fundamental reason for the downtrend is the uptrend in the U.S. Dollar (USD) which is experiencing a period of renewed strength, driven largely by shifting expectations regarding Federal Reserve monetary policy and resilient economic indicators. Gold trades inversely to the U.S. Dollar.
_____________
Technical Analysis is about trading with the trend
Note: This technical analysis is for educational purposes. Please conduct your own analysis or consult a financial advisor before making investment decisions. The author of this article may hold long or short positions in the featured stocks or indexes. The article was written with the help of AI and was reviewed by an editor.
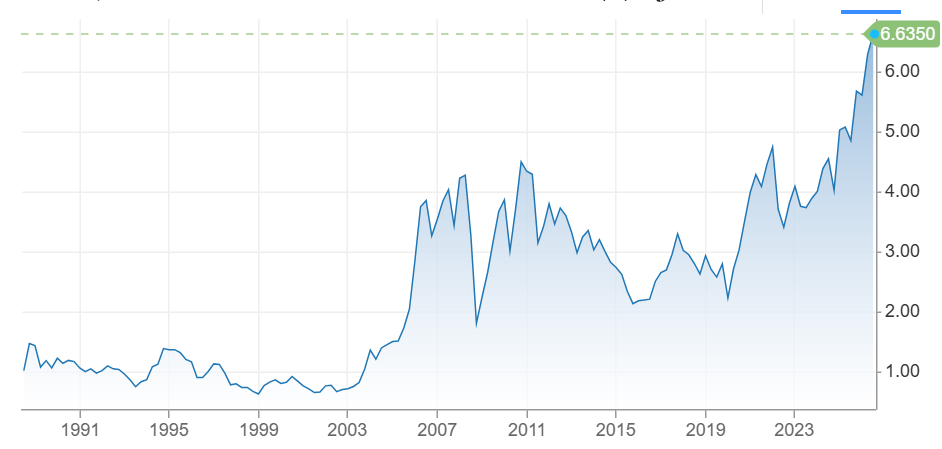
The rally is accelerating as speculative buyers and industrial hedgers scramble to secure physical supply.
COMEX Copper: Hit a new intraday all-time high of $6.58 per pound this morning, currently settling around $6.53/lb (+1.8%).
LME Copper: Trading near $13,950 per metric ton, holding the gains from yesterday’s record settlement of $13,943.
Performance: The metal is now up approximately 15% year-to-date, with nearly 8% of those gains occurring since the intensification of the conflict in the Middle East.
Why the Rally Won’t Quit
Beyond the “Grasberg” supply shock from Freeport Indonesia, two new catalysts are dominating the tape today:
The “Strait of Hormuz” Premium: Analysts are now labeling copper a “geopolitical defensive asset.” With shipping routes through the Strait of Hormuz effectively suspended, the global refining market is facing a massive “sulphuric acid” shortage. Since sulphuric acid is critical for copper leaching, this is creating a secondary supply squeeze on top of the mining delays.
Tariff Front-Running: There is growing evidence that U.S. buyers are “front-running” anticipated 25% refined copper tariffs expected to be announced by the White House before June. This is causing a massive dislocation between US and London prices as stocks are hoarded on North American soil.
AI Data Center Demand: New reports suggest that global AI power infrastructure requirements for 2026 are 20% higher than initial projections, further tightening the structural deficit.
The 2008 oil price spike, which saw West Texas Intermediate (WTI) crude hit an all-time record of $147.27 per barrel in July, was a “perfect storm” of economic, geopolitical, and financial factors. It wasn’t caused by a single event, but rather a collision of supply and demand that many at the time called the “Third Oil Shock.”
Here is the breakdown of what drove prices into the stratosphere:
1. The “Demand Shock” (Emerging Giants)
The single biggest driver was the rapid industrialization of China and India.
The Awakening: These two nations were growing at nearly 10% GDP, shifting millions of people into the middle class who were buying cars and using electricity for the first time.
Inelasticity: Global demand was growing so fast that it didn’t matter if prices went up; these emerging economies needed the fuel to keep their factories running, creating a “bidding war” for every available barrel.
2. Stagnant Global Supply
While demand was skyrocketing, the world’s ability to pump more oil had hit a wall.
Spare Capacity: Historically, Saudi Arabia kept enough “spare capacity” to flood the market if prices got too high. By 2008, that cushion had dwindled to almost nothing.
Non-OPEC Struggles: Production in places like the North Sea and Mexico was in natural decline, and new projects (like deep-water drilling) were taking years longer than expected to come online.
Peak Oil Fears: This was the era where the “Peak Oil” theory went mainstream—the fear that the world had already reached its maximum physical production limit.
3. Geopolitical Risk Premium
Investors added a “fear tax” to the price of oil due to constant instability in key producing regions:
The Middle East: Continued fallout from the Iraq War and rising tensions with Iran over its nuclear program led to fears of a closure of the Strait of Hormuz.
Nigeria: Militant attacks on pipelines in the Niger Delta frequently knocked hundreds of thousands of barrels per day offline.
Venezuela: Political friction between the U.S. and Hugo Chávez’s government led to concerns about supply reliability from one of the U.S.’s biggest providers.
4. The Weakening U.S. Dollar
Oil is priced globally in U.S. Dollars ($USD$). In 2008, the dollar was losing value rapidly against the Euro and other currencies.
The Hedge: When the dollar weakens, oil prices usually rise to compensate.
Foreign Buyers: For a buyer in Europe using Euros, oil didn’t actually feel as “expensive” as it did to an American, because their currency was stronger. This kept global demand high even as prices in dollars soared.
5. Financial Speculation (“The Bubble”)
This is the most debated cause. Many analysts believe the “financialization” of commodities played a role.
Index Funds: Huge amounts of pension fund and hedge fund money flowed into “commodity index funds.” These investors weren’t buying oil to use it; they were buying it as a financial asset.
The Momentum: This created a feedback loop—as prices rose, more speculative money flowed in, pushing prices even higher until the bubble finally burst during the Great Financial Crisis later that year.
Comparison: 2008 vs. Today
Factor
2008 Peak ($147)
2026 Context
Main Driver
China’s Industrialization
Geopolitical Conflict (ME/Ukraine)
Supply
Physical Scarcity Fears
Sufficient Supply (Shale/OPEC+)
US Dollar
Record Weakness
Generally Stronger
Demand
Rapidly Rising
Transitioning (EVs/Renewables)
The spike ended abruptly in late 2008 when the global financial system collapsed. Demand vanished almost overnight, and oil plummeted from $147 to under $40 in just six months—one of the most violent “price destructions” in history.
Considering the recent spikes we’ve seen in WTI and HOU.TO, do you think today’s geopolitical tensions are creating a similar “fear premium” to what we saw in 2008?
_____________
Technical Analysis is about trading with the trend
Note: This technical analysis is for educational purposes. Please conduct your own analysis or consult a financial advisor before making investment decisions. The author of this article may hold long or short positions in the featured stocks or indexes. The article was written with the help of AI and was reviewed by an editor.
Analysis: This was published in WSJ today. It is worth the read.
While traditional energy investors spent the past weekend counting down the minutes until futures markets reopened on Sunday, overseas crypto traders were already placing their bets on the direction of oil prices.
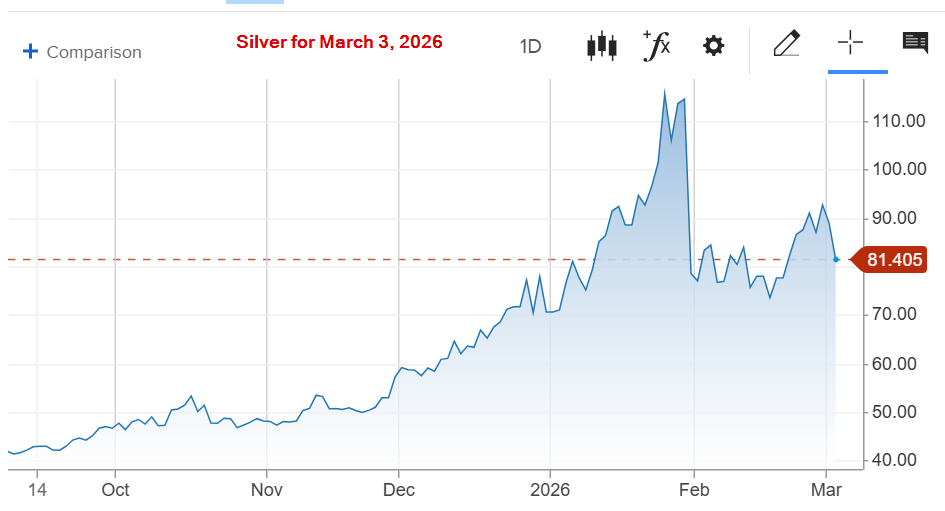
Silver is seeing a significant sell-off this morning, Tuesday, March 3, 2026, primarily because the initial “geopolitical shock” that drove prices to record highs over the weekend is beginning to fade, leading to aggressive profit-taking.
While gold is holding up better as a pure safe-haven, silver (the “restless cousin”) is down sharply—dropping as much as 7-8% in early trading to move back toward the $82–$84/oz range.
Here are the three specific factors driving the move:
1. The “Safe-Haven” Rotation to the US Dollar
While silver often benefits from geopolitical tension (like the current conflict involving the US, Israel, and Iran), the US Dollar Index (DXY) has surged to a 5-week high (near 98.5). In times of extreme uncertainty, global capital often flows into the dollar and US Treasuries rather than metals. Since silver is priced in dollars, a stronger greenback makes it more expensive for international buyers, creating immediate downward pressure.
2. Shifting Fed Expectations (The “September” Delay)
Stronger-than-expected US manufacturing and inflation data (ISM Prices Paid hitting a 3.5-year high) have changed the math for interest rates.
The News: Markets have pushed back the expected timing for the next Federal Reserve rate cut from July to September 2026.
The Impact: Silver provides no yield (interest). When interest rates are expected to stay “higher for longer,” the opportunity cost of holding silver increases, causing traders to dump positions in favor of bonds.
3. Technical Profit-Taking & “Stop-Hunting”
Silver had an “explosive surge” reaching near $95–$96/oz on Sunday/Monday.
Overbought: The Relative Strength Index (RSI) hit extreme levels (above 70), signaling the market was overextended.
The Cascade: Once silver failed to hold the $95 “make-or-break” resistance level this morning, it triggered a wave of “stop-loss” orders, accelerating the slide as short-term momentum traders exited their positions simultaneously.
Summary Table: Silver’s Morning Slide
Metric
Status (Mar 3, 2026)
Current Spot Price
~$84.20/oz
Daily Change
-7.2% to -8.5%
Key Support
$82.00 / $81.50
Main Catalyst
Strengthening USD + Delayed Fed Rate Cuts
_____________
Technical Analysis is about trading with the trend
Note: This technical analysis is for educational purposes. Please conduct your own analysis or consult a financial advisor before making investment decisions. The author of this article may hold long or short positions in the featured stocks or indexes. The article was written with the help of AI and was reviewed by an editor.
Based on data from the OPEC Annual Statistical Bulletin 2025 and the Energy Institute Statistical Review.
Rank
Country
Reserves (Billion Barrels)
World Share (%)
1
Venezuela
303.2
17.2%
2
Saudi Arabia
267.2
15.1%
3
Iran
208.6
11.8%
4
Canada
163.1
9.2%
5
Iraq
145.0
8.2%
6
United Arab Emirates
113.0
6.4%
7
Kuwait
101.5
5.8%
8
Russia
80.0
4.5%
9
Libya
48.4
2.7%
10
United States
45.0
2.5%
Key Market Observations
OPEC Dominance: Members of the Organization of the Petroleum Exporting Countries (OPEC) control roughly 79% of the world’s proven reserves.
The Venezuela Paradox: While Venezuela holds the largest reserves, much of its oil is “extra-heavy” crude, which is expensive to extract and refine. Consequently, its actual production often lags far behind countries like the U.S. or Saudi Arabia.
Canadian Oil Sands: Canada’s high ranking is largely due to the oil sands in Alberta. Like Venezuela, these are more difficult and costly to process than the “light sweet” crude found in the Middle East.
Production vs. Reserves: The United States is currently the world’s leading oil producer, yet it ranks 10th in reserves. This highlights how quickly a country can extract its resources versus how much it has left in the ground.
Emerging Regions
Keep an eye on Guyana, which has seen a meteoric rise in proven reserves (now over 11 billion barrels) following massive offshore discoveries. It is currently one of the fastest-growing oil provinces in the world.
Note: “Proven reserves” are those that can be recovered with “reasonable certainty” under current economic and operating conditions. These numbers change as new technology makes extraction cheaper or as new fields are discovered.
Canada’s oil reserves can be ranked by type and location. Here’s a breakdown of the major categories, along with their approximate reserves:
Rank
Category
Location
Estimated Reserves
1
Oil Sands
Alberta
Approx. 167 billion barrels (over 97% of Canada’s total reserves)
2
Conventional Oil
Saskatchewan
Approx. 7 billion barrels
3
Conventional Oil
Newfoundland and Labrador
Approx. 1.6 billion barrels
4
Tight Oil (Shale Oil)
Alberta and Saskatchewan
Approx. 1 billion barrels (estimates vary)
Additional Notes
Oil Sands: The vast majority of Canada’s oil is found in the oil sands of Alberta, where it is extracted using surface mining and in-situ techniques.
Conventional Oil: While smaller in comparison to oil sands, conventional oil reserves are significant in provinces like Saskatchewan and Newfoundland.
Tight Oil: Tight oil, extracted from shale formations, is increasingly becoming a part of Canada’s oil output, although it remains a smaller portion of total reserves.
Note: Published with the assistance of AI and reviewed by an editor
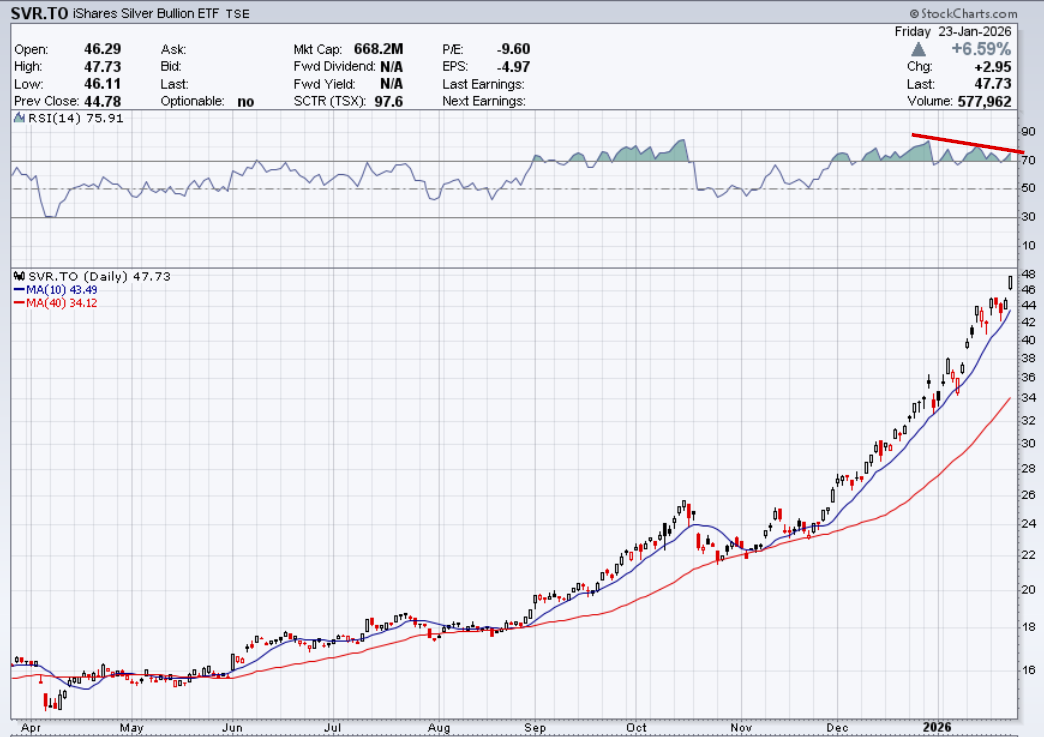
While the price of SVR has hit record highs (around $47.73), the underlying momentum indicators are telling a different story. This is a classic technical “red flag” that often precedes a price correction.
1. RSI Bearish Divergence (The Momentum Gap)
The most prominent divergence is between the Price and the Relative Strength Index (RSI):
The Price: SVR has made “Higher Highs” throughout January, climbing from $33 to over $47.
The RSI: The RSI momentum indicator peaked in mid-January (reaching an extreme overbought level above 85) and has since been making “Lower Highs.”
What this means: Even though the price is still going up, the strength of the buying pressure is weakening. It’s like a car still rolling uphill but with its engine losing power.
2. Premium Divergence (The “Retail Fever”)
There is also a divergence between the ETF Price and the Physical Silver Value:
As we noted, SVR is trading at a 3.67% premium to its Net Asset Value (NAV).3
Normally, this premium stays near 0%. When it “diverges” and stays high while silver hits $100, it indicates that retail panic-buying is driving the ticker more than the actual value of the silver bars in the vault.
The Danger: If the rally pauses, this premium often evaporates instantly, causing the ETF to drop significantly faster than the spot price of silver.
Summary of Technical Signals (Jan 25, 2026)
Indicator
Signal
Interpretation
Price Action
Bullish
SVR is comfortably above its 50-day ($30.76) and 200-day ($21.56) averages.
RSI (14-day)
Bearish Divergence
Price is making new highs; RSI is making lower highs (currently ~73).
Premium/NAV
Bearish
+3.67% premium is historically unsustainable and suggests “froth.”
Candlesticks
Caution
Recent “long-wick” candles near $48 suggest sellers are starting to overpower buyers at these levels.
Technical Strategy
In 2026, many traders are using the $44.00 level as their “line in the sand.”
If SVR stays above $44.00, the “parabolic” trend is still alive.
If it closes below $44.00 on high volume, the bearish divergence is officially “confirmed,” and the first target for a correction would likely be the 20-day moving average, currently near $38.00.
_____________
Technical Analysis is about trading with the trend
Note: This technical analysis is for educational purposes. Please conduct your own analysis or consult a financial advisor before making investment decisions. The author of this article may hold long or short positions in the featured stocks or indexes. The article was written with the help of AI and was reviewed by an editor.
This history is often described by economists and nationalists as the “Hollowing Out of Corporate Canada.”
The Thesis: From “Builder” to “Branch”
Fifty years ago, Canada didn’t just dig rocks; it built the global companies that managed them. Toronto and Vancouver were the command centers of the global mining industry. Today, while the mines are still here (they can’t move), the decisions are largely made in Switzerland (Glencore), Brazil (Vale), London (Rio Tinto), and Australia (BHP).
Era 1: The Golden Age of Canadian Giants (1970s – 2005)
In this era, Canadian companies were the predators, not the prey. They aggressively acquired assets globally.
The Big Four: The industry was dominated by four massive, Canadian-headquartered titans:
Inco (International Nickel Company): Based in Toronto, it controlled the global nickel market from Sudbury, Ontario.
Falconbridge: Another nickel/copper giant, Inco’s fierce rival, also based in Toronto.
Noranda: A massive diversified miner and smelter (Quebec roots) that was a crown jewel of Canadian industry.
Alcan (Aluminum Company of Canada): Based in Montreal, it was the second-largest aluminum producer in the world.
The Status Quo: These companies developed world-leading technology (like Inco’s flash smelting) and their CEOs were powerful figures in Canadian public policy.
Era 2: The “Great Exodus” (2005 – 2007)
In a span of just 24 months, Canada lost almost its entire top tier of mining companies to foreign buyouts. This period effectively ended Canada’s reign as a global mining manager.
2006: The Loss of Falconbridge & Noranda
The Deal: After a complicated bidding war, Xstrata (a Swiss-Anglo giant) acquired Falconbridge (which had just merged with Noranda) for $18 billion.
The Result: One of Canada’s oldest mining names disappeared into a Swiss conglomerate (which later merged with Glencore).
2006: The Loss of Inco
The Deal: In a shock to national pride, Inco was acquired by Vale (CVRD) of Brazil for $19 billion.
The Context: Inco had tried to merge with Falconbridge to create a “Canadian Super-Miner” to fight off foreign takeovers, but the deal failed. Vale swooped in, and the “Sudbury Basin” effectively became a Brazilian outpost.
2007: The Loss of Alcan
The Deal:Rio Tinto (UK/Australia) bought Alcan for $38 billion.
The Result: It was renamed “Rio Tinto Alcan.” While the HQ technically stayed in Montreal for the aluminum division, the strategic power shifted to London.
Why did this happen?
The Canadian government (under Stephen Harper) approved these deals under the Investment Canada Act, declaring they were a “net benefit” to Canada. Critics argued it stripped Canada of its head offices, R&D departments, and high-paying legal/financial service jobs.
Era 3: The “Critical Minerals” Pivot & The Last Stand (2008 – 2024)
After the 2006 exodus, the government realized it had made a mistake. The narrative shifted from “free market” to “strategic protectionism,” especially regarding Potash and Critical Minerals.
2010: The BHP-PotashCorp Block
A pivotal moment. BHP Billiton (Australia) tried to buy PotashCorp (Saskatchewan) for $40 billion.
The Twist: The federal government blocked the deal—the first time it had ever used the “Net Benefit” test to stop a major takeover. They realized losing the world’s largest fertilizer company was a bridge too far. (PotashCorp eventually merged with Agrium to form Nutrien, keeping it Canadian).
2023-2024: The Teck Resources Saga
Teck Resources was the “Last Mohican”—the last major diversified miner left in Canada.
The Glencore Raid: In 2023, Glencore launched a hostile takeover bid for the entire company.
The Defense: The Canadian government and the Keevil family (who controlled Teck’s voting shares) pushed back, citing “Critical Minerals” security.
The Compromise (The Split): Teck agreed to sell only its coal assets (Elk Valley) to Glencore (completed mid-2024), keeping the “green metals” (Copper/Zinc) as a standalone Canadian company… until late 2025.
Era 4: The “Merger of Equals” Era (2025 – Present)
The definition of “Takeover” has changed. Foreign companies now propose “Mergers” to avoid the political heat of a “Takeover.”
Late 2025: The Anglo-Teck Merger
In September 2025, Teck Resources and Anglo American announced a $70B merger.
The Spin: They call it a “merger of equals” with a headquarters in Canada, but Anglo shareholders own ~62% of the company. It effectively marks the end of Teck as a purely independent Canadian entity, though it survives in name.
2025-2026: The New Reality
Today, “Canadian Mining” is largely composed of Mid-Tier companies (like Agnico Eagle, First Quantum, Lundin). The “Global Majors” are almost entirely foreign-owned.
Summary Table
Company
Acquired By
Country of Buyer
Year
Price
Noranda / Falconbridge
Xstrata (now Glencore)
Switzerland/UK
2006
~$18B
Inco
Vale
Brazil
2006
~$19B
Alcan
Rio Tinto
UK/Australia
2007
~$38B
Teck (Coal Division)
Glencore
Switzerland
2024
~$9B
Teck (Metals Division)
Anglo American (Merger)
UK
2025
~$70B (Deal value)
Key Takeaway:
The last 50 years was a transition from “Owners” to “Operators.” Canada is still a mining superpower in terms of geology and production, but it is no longer a superpower in terms of capital and control.
Just hours ago, news broke that Glencore and Rio Tinto are in preliminary merger talks. If this deal happens, it would create the largest mining company in history, valued at over $200 billion.
Here is the breakdown of Glencore’s situation and its massive footprint in Canada.
1. The Headline: The “Mega-Merger” Talks
The News (Jan 9, 2026): Glencore shares jumped roughly 10% today following reports that rival Rio Tinto is considering a bid to acquire the company.
The Logic:
Rio Tinto wants copper for the energy transition (EVs, Data Centers), and Glencore is one of the world’s largest copper producers.
The Problem: Rio Tinto exited the coal business years ago to be “green.” Glencore is the world’s biggest thermal coal shipper.
The Timeline: Under UK takeover rules, Rio Tinto has until February 5, 2026, to make a formal offer or walk away.
2. The Canadian “Coal Giant” (Elk Valley)
For your Canadian context, Glencore is now a dominant player in British Columbia.
The Acquisition: In mid-2024, Glencore completed the purchase of Teck Resources’ steelmaking coal business (Elk Valley Resources) for roughly $9 billion USD.
Current Status: Glencore now owns the massive Fording River, Elkview, and Greenhills mines in BC.
Why it matters: This is “Metallurgical Coal” (used to make steel), not “Thermal Coal” (burned for power). It is highly profitable and was a key reason Glencore wanted the assets.
The Spin-Off Question: Originally, Glencore planned to spin this coal business off into a separate company on the NYSE. That plan is currently in limbo. With the Rio Tinto talks happening, they may keep it or sell it to satisfy Rio’s ESG concerns.
3. Commodity Mix & Production
Copper (The Crown Jewel): This is the main attraction for investors. Glencore aims to produce 1.6 million tonnes of copper annually by 2035. However, production in late 2025 was softer than expected due to mine sequencing issues.
Cobalt: They remain the world’s largest producer of cobalt (essential for EV batteries), primarily from the Democratic Republic of Congo (DRC).
Zinc & Nickel: They are a top-tier global supplier, giving them immense leverage in the “Battery Metals” supply chain.
4. The “Old” Glencore Baggage
Legal/ESG: While the company settled its massive bribery investigations in 2022 (paying ~$1.5B in fines), individual accountability is still ongoing. In November 2025, several former executives entered “Not Guilty” pleas in a UK court regarding corruption charges. A trial is set for late 2027.
Reputation: This “legacy” issue is one of the reasons Glencore trades at a discount compared to BHP or Rio Tinto, making it an attractive takeover target.
Summary for Your Business
If the Merger Happens: Expect massive rebranding and contract reviews. Rio Tinto has stricter supplier standards than Glencore. If you service the old Teck mines in BC, a Rio takeover could change your procurement contacts.
If it Doesn’t: Glencore remains a cash-rich giant that is aggressively paying down debt and generating huge cash flow from its new Canadian coal mines.
Based on the most recent financial data available for the 2024–2025 fiscal year, here is the summary of the world’s largest metal producers by revenue.
The rankings are heavily skewed by business model. You have to separate the “Traders” (who sell other people’s metal) from the “Miners” (who dig it out of the ground) and the “Steelmakers” (who refine it).
1. The “Hybrid” Giant (Trading + Mining)
Glencore sits in a category of its own because its revenue includes its massive “Marketing” division (buying and selling commodities produced by third parties).
Rank
Company
Country
Revenue (USD)
Primary Metals
#1
Glencore
🇨🇭 Swiss / 🇬🇧 UK
~$231 Billion
Copper, Coal, Zinc, Cobalt
Context: While Glencore has huge revenue, its profit margins are much thinner than the pure miners because trading is a high-volume, low-margin game.
2. The “Pure” Mining Giants
These companies have lower revenue than Glencore but often higher profits because they own the assets (mines) and sell what they dig.
Rank
Company
Country
Revenue (USD)
Primary Metals
#1
BHP Group
🇦🇺 Australia
~$55.7 Billion
Iron Ore, Copper, Coal
#2
Rio Tinto
🇬🇧 UK / 🇦🇺 Australia
~$53.7 Billion
Iron Ore, Aluminum, Copper
#3
Vale S.A.
🇧🇷 Brazil
~$38.1 Billion
Iron Ore, Nickel
#4
Freeport-McMoRan
🇺🇸 USA
~$26.0 Billion
Copper, Gold
Merger Impact: If Rio Tinto ($53.7B) buys Glencore ($231B), the combined entity would have revenues exceeding $280 Billion, dwarfing every other competitor in the sector.
3. The State-Owned Powerhouses (China)
Western lists often ignore these, but they are technically the largest metal producers by volume and revenue.
Rank
Company
Country
Revenue (USD)
Primary Metals
#1
China Minmetals
🇨🇳 China
~$115 Billion
Diversified (Copper, Zinc, Lead)
#2
Jiangxi Copper
🇨🇳 China
~$72 Billion
Copper
#3
Zijin Mining
🇨🇳 China
~$41 Billion
Copper, Gold, Lithium
4. The Steel Giants
Steelmakers generate massive revenue due to the high value of the finished product, even if their margins are tight.
Rank
Company
Country
Revenue (USD)
Primary Metals
#1
China Baowu Group
🇨🇳 China
~$160 Billion
Steel
#2
ArcelorMittal
🇱🇺 Luxembourg
~$62.4 Billion
Steel
#3
Nippon Steel
🇯🇵 Japan
~$61.2 Billion
Steel
#4
POSCO Holdings
🇰🇷 South Korea
~$51.4 Billion
Steel, Battery Materials
Summary Trend for Your Business
The “Big Three” Iron Ore Players (BHP, Rio, Vale): They are cash cows, but their revenues are essentially flat or slightly down due to weaker Chinese construction demand.
The “Green Metal” Players (Glencore, Jiangxi, Freeport): These are the ones seeing revenue volatility (and growth potential) tied to the Copper boom for data centers and EVs.
If the Glencore-Rio Tinto merger proceeds, the combined entity would be a behemoth in the Canadian resource sector, but surprisingly, their assets do not overlap much. Instead, they fit together like puzzle pieces, creating massive regional dominance.
Here is the breakdown of what a “Rio-Glencore” map of Canada would look like, by province.
1. Quebec: The Industrial Fortress
This is where the merger would be most powerful. A combined company would effectively control the entire base metal processing capacity of the province.
Rio Tinto’s Assets (Aluminum & Titanium):
Alcan Operations: Owns the massive aluminum smelters in the Saguenay–Lac-Saint-Jean region (Alma, Arvida, Grande-Baie, Laterrière).
Sorel-Tracy: Owns Rio Tinto Fer et Titane, which mines titanium and iron ore at Havre-Saint-Pierre and processes it in Sorel-Tracy.
Glencore’s Assets (Copper & Zinc):
Rouyn-Noranda: Owns the Horne Smelter, the only copper smelter in Canada (critical for recycling electronics).
Montreal (East): Owns the CCR Refinery, which processes the copper from the Horne Smelter.
Valleyfield: Owns CEZinc, the second-largest zinc refinery in North America.
Raglan Mine: Massive nickel mine in Nunavik (far north Quebec).
The Impact: If you print for industrial safety, training, or logistics in Quebec, this single company would control the Aluminum, Copper, Zinc, Titanium, and Nickel supply chains. They would be the province’s largest industrial employer by far.
2. British Columbia: The “Green vs. Black” Conflict
This is where the merger gets messy politically.
Rio Tinto (The “Green” Giant):
Kitimat: Owns the massive “BC Works” aluminum smelter, powered by its own hydroelectric dam (Kemano). It markets this as “low carbon aluminum.”
Glencore (The “Black” Giant):
Elk Valley: As of 2024, owns the massive steelmaking coal mines (formerly Teck Resources) in the southeast Rockies (Fording River, Elkview, Greenhills).
The Conflict: Rio Tinto spent years exiting coal to polish its ESG image. Buying Glencore brings them right back into the coal business in BC. Analysts speculate Rio might spin these coal mines off again to keep their “green” investors happy.
3. Ontario: The Sudbury/Timmins Split
Glencore’s Turf:
Sudbury: Owns “Sudbury INO” (Integrated Nickel Operations) – a major nickel/copper miner and smelter.
Timmins: Owns the Kidd Creek mine (Copper/Zinc). Note: This mine is nearing the end of its life (scheduled closure ~2026/2027), so it’s less of a long-term factor.
Rio Tinto’s Turf:
Rio has effectively no presence in Ontario mining. That is Vale (Brazilian) territory.
The Impact: This is good for regulators. Since there is no overlap in Sudbury, the Competition Bureau likely won’t block the deal on Ontario grounds.
4. Newfoundland & Labrador: The Iron King
Rio Tinto:
Owns the majority stake (~59%) in the Iron Ore Company of Canada (IOC).
Assets: Massive mines in Labrador City and the railway/port in Sept-Îles, Quebec.
Glencore:
Has no major operational footprint here, though they trade iron ore globally.
Summary for Your Business (The “Client List” Shift)
If this merger happens, the “Procurement Department” for half of Canada’s mining industry consolidates.
The Opportunity: If you are already a vendor for Rio Tinto, you essentially get a “hunting license” to pitch your services to the Glencore sites (Sudbury Nickel, Quebec Copper) that might adopt Rio’s standards.
The Risk: If you are a vendor for Glencore, get ready for a paperwork headache. Rio Tinto is known for having more rigid, bureaucratic supplier compliance standards than Glencore.
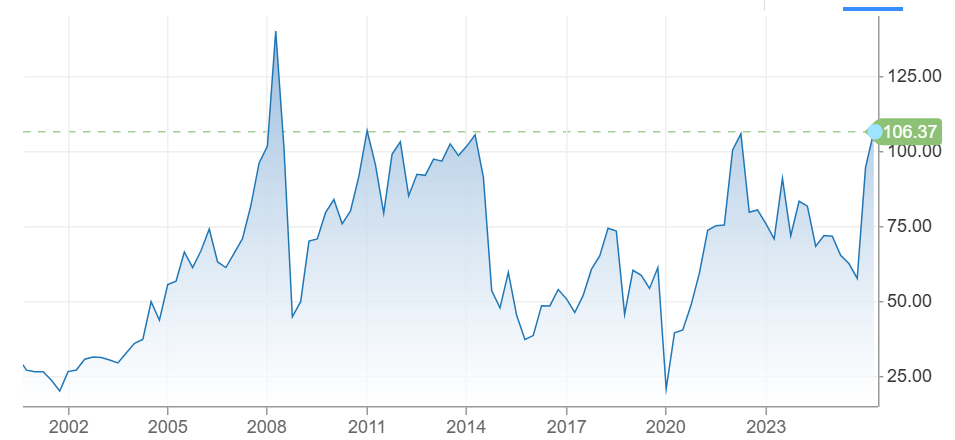
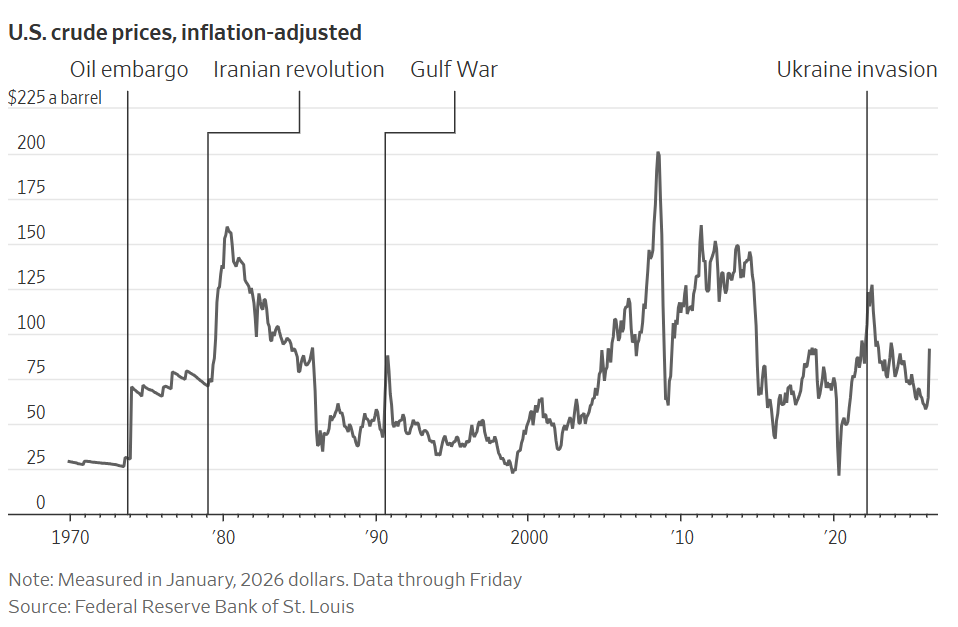
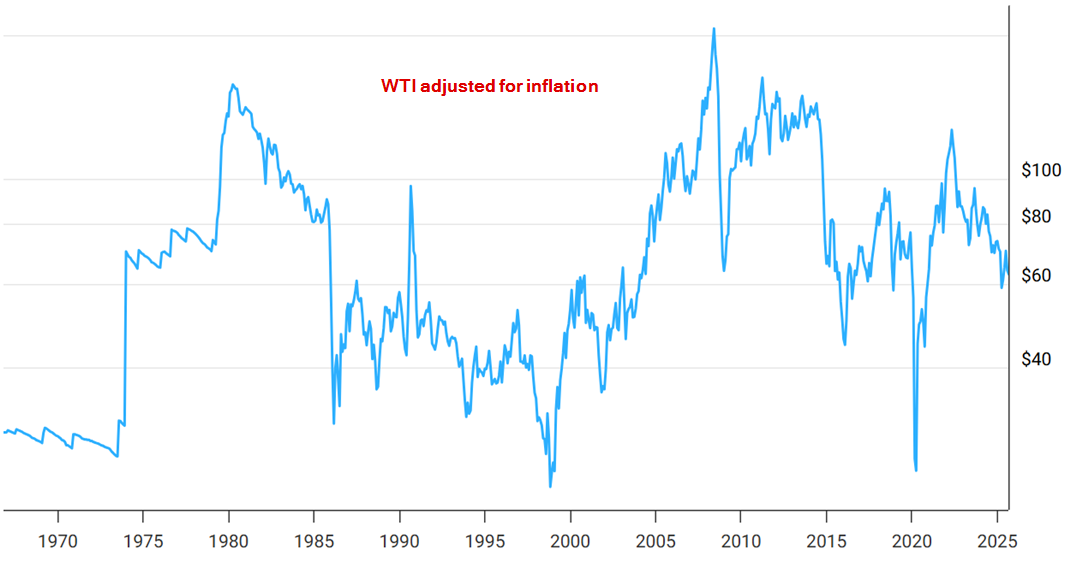
As of January 2, 2026, the price of WTI Crude Oil is approximately $57.50 USD per barrel. The price of oil shown in the chart is adjusted for inflation using the headline CPI and is shown by default on a logarithmic scale.
1. The Era of Cheap Oil (1968–1972)
Before the formation of OPEC as a political force, oil prices were remarkably stable and controlled largely by the “Seven Sisters” (major US/European oil companies).
1968 Price:~$3.00
Context: Oil was abundant and cheap. The US was the world’s swing producer, and prices rarely moved more than a few cents.
2. The Oil Shocks (1973–1985)
Everything changed in the 1970s when control of pricing shifted from Western companies to Middle Eastern nations.
1973 (The First Shock): Prices tripled from $4 to $12 following the Arab Oil Embargo (Yom Kippur War).
1979 (The Second Shock): Prices doubled from $15 to $39.50 following the Iranian Revolution.
1980 Peak: Reached an inflation-adjusted high that wouldn’t be beaten until 2008.
3. The Great Collapse & The “Lost Decade” (1986–1999)
A massive oversupply (the “Glut”) caused prices to crash, leading to a long era of cheap energy.1
1986 Crash: Saudi Arabia tired of cutting production and flooded the market.2 Prices collapsed from $30 to $10 in roughly four months.
1990 Spike: Briefly hit $40 during the Gulf War (Iraq/Kuwait) but quickly fell back.3
1998 Low: The Asian Financial Crisis crushed demand, sending oil down to $11.90 per barrel.
4. The “Supercycle” (2000–2014)
Driven by the industrialization of China and India, demand exploded.4
2000-2007: steady climb from $25 to $90.
2008 Peak: WTI hit its all-time record of $147.27 in July 2008.
2008 Crash: The Global Financial Crisis sent it crashing down to $33 by December.
2011–2014: The “Hundred Dollar Era.” Prices stabilized over $100 for nearly three years due to the Arab Spring.
5. The Shale Revolution & COVID (2015–2021)
US Fracking technology flooded the market with new supply, breaking OPEC’s grip.
2014 Crash: Prices fell from $107 to $50 as OPEC refused to cut production to fight US shale.5
2020 (The Anomaly): During the pandemic lockdowns, demand vanished. On April 20, 2020, WTI futures briefly traded at negative -$37.63 (traders paid people to take the oil).
6. The War & The Correction (2022–2026)
2022 High: Russia’s invasion of Ukraine sent prices back to $123.
2023–2024: Prices slowly ground lower as interest rates rose and US production hit record highs.
Late 2025/Early 2026: Prices have softened significantly to the $57–$60 range due to fears of oversupply and weak demand from China.6
We use cookies to ensure that we give you the best experience on our website. If you continue to use this site we will assume that you are happy with it.