Technical Analysis is about trading with the trend
Note: This technical analysis is for educational purposes. Please conduct your own analysis or consult a financial advisor before making investment decisions. The author of this article may hold long or short positions in the featured stocks or indexes.
Adjusted earnings per share were $3.84, well above the average analyst expectation of $3.29 per share, according to S&P Capital IQ.
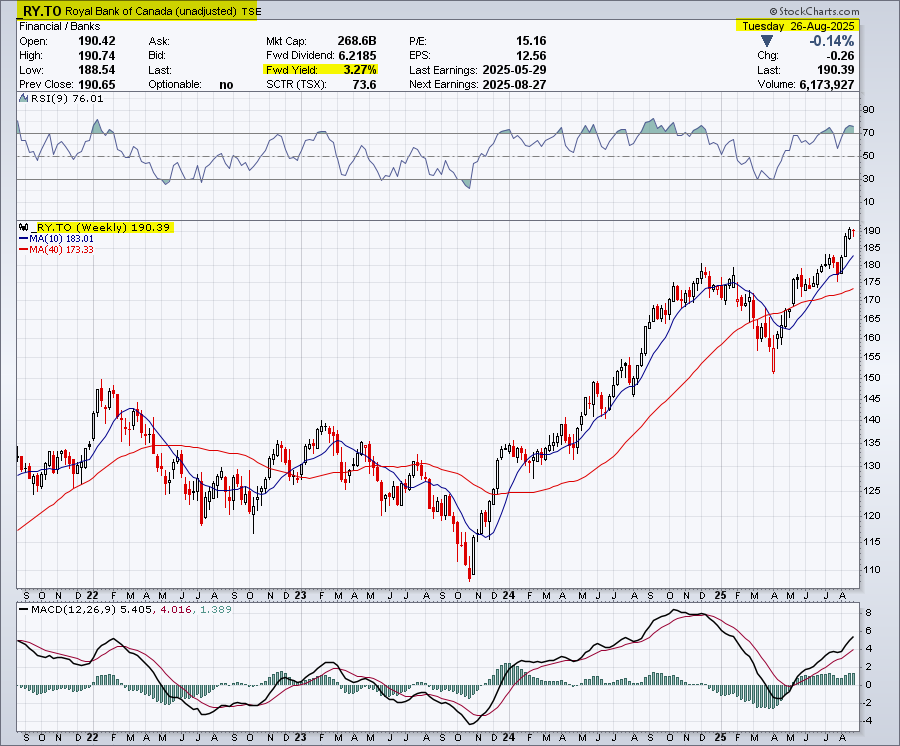
Here is a 4-year candlestick chart:
Royal Bank of Canada (RBC) is a Canadian multinational financial services company and the largest bank in Canada by market capitalization. Founded in 1864, it operates globally and is a publicly traded company on the Toronto, New York, and SIX Swiss exchanges under the symbol RY.
Business Segments and Services
RBC is a diversified financial institution with five main business segments:
Personal and Commercial Banking: This is its largest segment, offering a wide array of financial products and services to individuals and businesses in Canada, the U.S., and the Caribbean. This includes credit cards, mortgages, loans, and everyday banking.
Wealth Management: Providing investment and wealth management solutions to clients worldwide. This segment includes its brokerage firm, RBC Dominion Securities, and RBC Global Asset Management.
Capital Markets: This is the investment banking arm, providing corporate and investment banking services, including mergers and acquisitions, debt and equity financing, and global markets solutions to corporations and institutional investors.
Insurance: Offering a range of life, health, home, auto, travel, and wealth insurance products for individuals and groups.
Investor and Treasury Services: Providing asset services, cash management, and treasury services to institutional clients.
Recent Financial Performance
In the third quarter of 2025, RBC reported a record net income of $5.4 billion, a significant increase from the previous year. This growth was driven by strong performance across all business segments, particularly in Capital Markets and Personal Banking. The bank also increased its quarterly dividend and maintained a robust capital position.
Technical Analysis is about trading with the trend
Note: This technical analysis is for educational purposes. Please conduct your own analysis or consult a financial advisor before making investment decisions. The author of this article may hold long or short positions in the featured stocks or indexes.
We use cookies to ensure that we give you the best experience on our website. If you continue to use this site we will assume that you are happy with it.