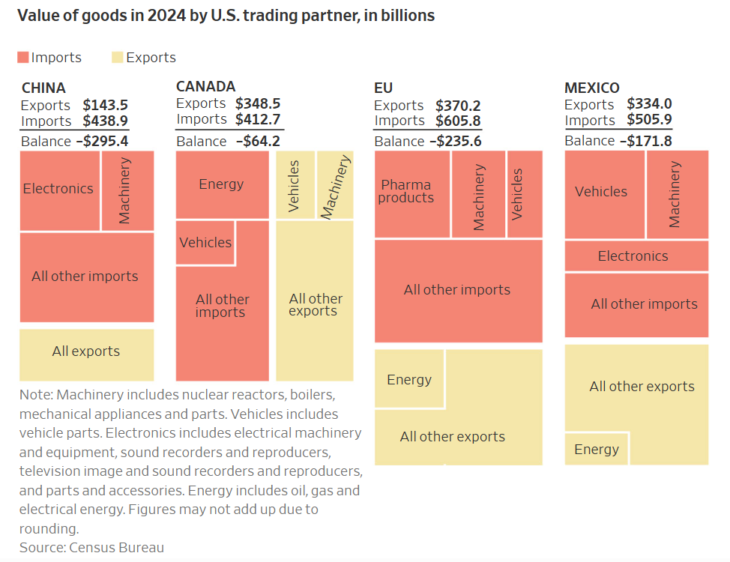
Tag Archives: China

MCHI China ETF down 31.7% from the 2021 high

China MCHI ETF

_________________

Technical Analysis is about identifying the trend

Note: This technical analysis is for educational purposes. Please conduct your own analysis or consult a financial advisor before making investment decisions. The author of this article may hold long or short positions in the featured stocks or indexes.

© 2021 TradeOnline.ca InvestOnline.ca

China’s growth profile from 1990

China's growth profile from 1990

http://www.bloomberg.com/news/articles/2016-01-14/a-towering-chinese-debt-mountain-looms-behind-market-gyrations

______________________________

“Technical Analysis is about probabilities.”

Note: Click on HOME for updated postings. This technical analysis is for educational purposes so you can learn to trade online using candlestick charts and other technical indicators including volume, moving averages and oscillators. Please conduct your own chart analysis or consult your financial advisor before making investment decisions. The author of this article may hold long or short positions in the featured stock or index.

© 2016 TradeOnline.ca

Positive SSL on a transparent background

Shanghai Index weekly chart

3000 is the critical support level

Shanghai Index 3-Year Weekly Chart

Shanghai Index 3-Year Weekly Chart

______________________________

“Technical Analysis is about probabilities.”

Note: Click on HOME for updated postings. This technical analysis is for educational purposes so you can learn to trade online using candlestick charts and other technical indicators including volume, moving averages and oscillators. Please conduct your own chart analysis or consult your financial advisor before making investment decisions. The author of this article may hold long or short positions in the featured stock or index.

© 2016 TradeOnline.ca

Positive SSL on a transparent background

Shanghai Index weekly chart

The key support level is 3500

Key support for the Shanghai Index is 3500

Shanghai Index 2-Year Chart

Reference the last chart analysis for the Shanghai Index.

______________________________

“Stay with the trend until it ends.”

Note: Click on HOME for updated postings. This technical analysis is for educational purposes so you can learn to trade online using candlestick charts and other technical indicators including volume, moving averages and oscillators. Please conduct your own chart analysis or consult your financial advisor before making investment decisions. The author of this article may hold long or short positions in the featured stock or index.

© 2015 TradeOnline.ca

Positive SSL on a transparent background

Shanghai Index weekly chart

China’s stock index will test the 40 week moving average

Shanghai Index will test the 40-week simple moving average.

Shanghai Index 3-Year Weekly Chart

______________________________

“Stay with the trend until it ends.”

Note: Click on HOME for updated postings. This technical analysis is for educational purposes so you can learn to trade online using candlestick charts and other technical indicators including volume, moving averages and oscillators. Please conduct your own chart analysis or consult your financial advisor before making investment decisions. The author of this article may hold long or short positions in the featured stock or index.

© 2015 TradeOnline.ca

Positive SSL on a transparent background