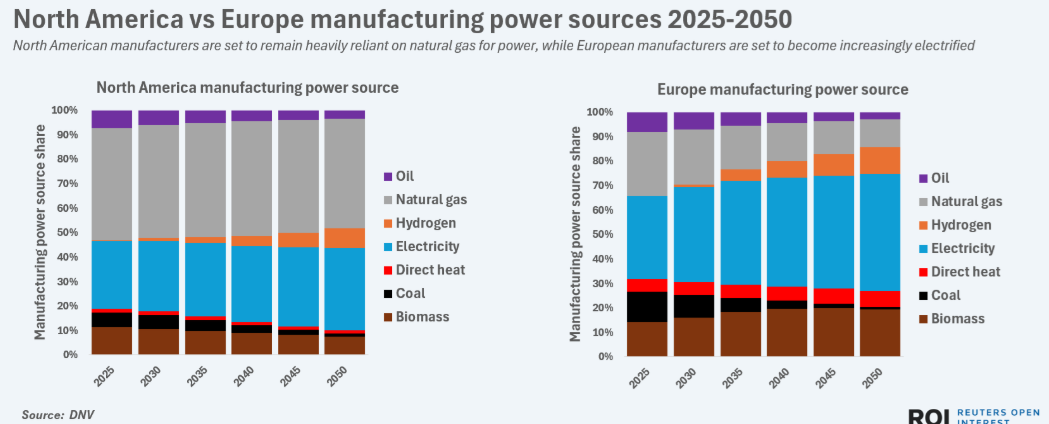
Reference my last chart analysis for natural gas when the major and intermediate trends were sideways
https://www.oilsandsmagazine.com/energy-statistics/oil-and-gas-prices
______________________________
Reference my last chart analysis for natural gas when the major and intermediate trends were sideways
https://www.oilsandsmagazine.com/energy-statistics/oil-and-gas-prices
______________________________
Major resistance is around $3.00 and major support is around $2.50
______________________________
The following is an excellent site for research: Natural Gas Weekly Update
______________________________
The following article and chart was published in the National post. This is an excellent article. Where is the price of thermal coal and natural gas headed for 2017?
______________________________
“Technical Analysis is about putting the probabilities on your side.”
Note: Click on HOME for updated postings. This technical analysis is for educational purposes so you can learn to trade online using candlestick charts and other technical indicators including volume, moving averages and oscillators. Please conduct your own chart analysis or consult your financial advisor before making investment decisions. The author of this article may hold long or short positions in the featured stock or index.
© 2017 TradeOnline.ca
Have a great trading day. Any questions? Email [email protected]
______________________________
“Technical Analysis is about probabilities.”
Note: Click on HOME for updated postings. This technical analysis is for educational purposes so you can learn to trade online using candlestick charts and other technical indicators including volume, moving averages and oscillators. Please conduct your own chart analysis or consult your financial advisor before making investment decisions. The author of this article may hold long or short positions in the featured stock or index.
© 2016 TradeOnline.ca
Major downtrend and intermediate downtrend for natural gas. Near-term uptrend will meet heavy resistance at the 40-week moving average. A break above this average would indicate a test at $2.50. Natural gas has a long way to go before it is out of the woods.
http://www.eia.gov/naturalgas/
______________________________
“Technical Analysis is about probabilities.”
Note: Click on HOME for updated postings. This technical analysis is for educational purposes so you can learn to trade online using candlestick charts and other technical indicators including volume, moving averages and oscillators. Please conduct your own chart analysis or consult your financial advisor before making investment decisions. The author of this article may hold long or short positions in the featured stock or index.
© 2016 TradeOnline.ca