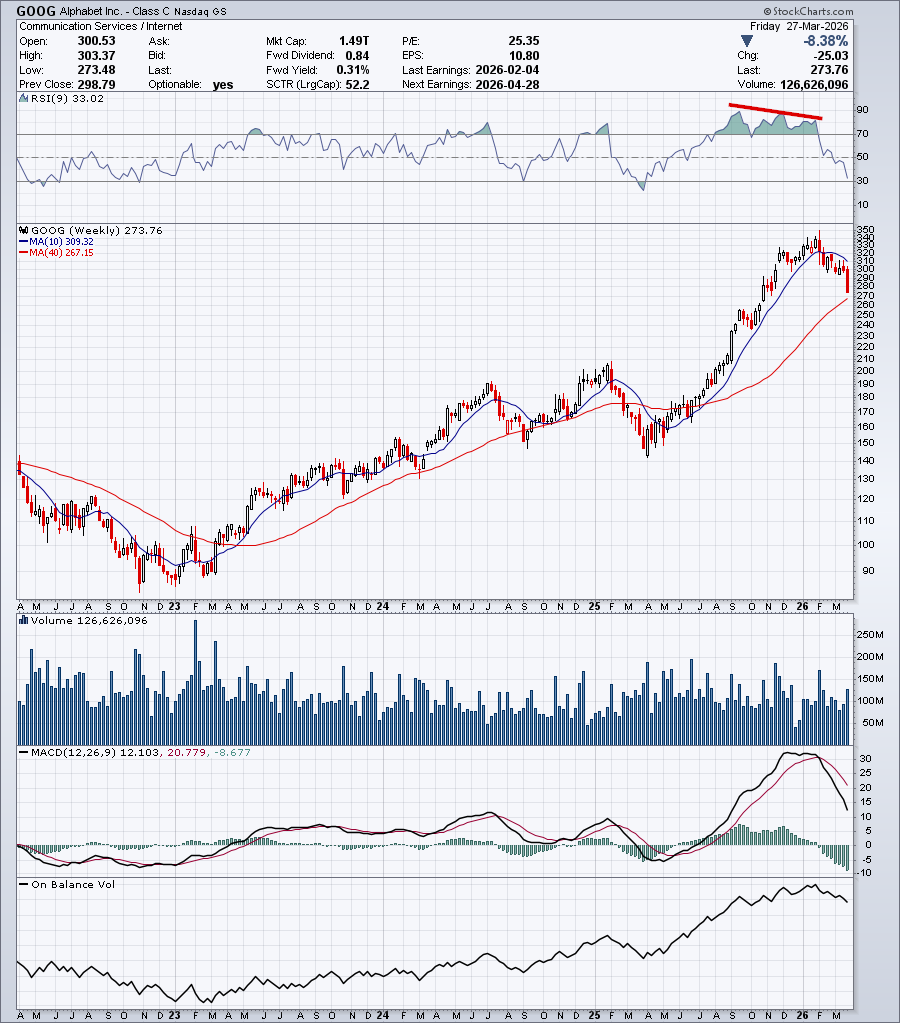
Analysis: This is an educational rear-view mirror post. What was an early indicator of the impending short-term downtrend? You can see the negative divergence on the RSI indicator as a early warning of the short-term downtrend. Can Google hold major support around the 200-day moving average? I say yes, but the market will have the finale say. We can easily be trumped.
_____________
Technical Analysis is about trading with the trend
Note: This technical analysis is for educational purposes. Please conduct your own analysis or consult a financial advisor before making investment decisions. The author of this article may hold long or short positions in the featured stocks or indexes. The article was written with the help of AI and was reviewed by an editor.
Technical Analysis is about trading with the trend
Note: This technical analysis is for educational purposes. Please conduct your own analysis or consult a financial advisor before making investment decisions. The author of this article may hold long or short positions in the featured stocks or indexes.
Analysis: Here is a 4-year candlestick chart for the index. It is overextended and due for consolidation or a pull back. But at this stage; the major trend is up, the intermediate trend is up and the the near-term trend is up.
The S&P/TSX Composite Index is a key benchmark for the Canadian stock market, representing a diverse range of sectors. As of August 2025, the index includes the following major sectors and their approximate weightings:
Sector
Approximate Weighting
Financials
32%
Energy
16%
Materials
12%
Industrials
10%
Consumer Discretionary
8%
Technology
7%
Real Estate
6%
Utilities
5%
Healthcare
4%
Sector Breakdown
Financials
The financial sector is the largest component of the TSX, driven by major banks like the Royal Bank of Canada (RBC) and Toronto-Dominion Bank (TD). This sector has seen strong performance due to robust earnings and lower loan loss provisions.
Energy
The energy sector benefits from rising oil prices and accounts for a significant portion of the index. Companies in this sector are influenced by global demand and geopolitical factors.
Materials
The materials sector includes mining and resource companies, which are sensitive to commodity prices. This sector has been performing well, reflecting the demand for natural resources.
Industrials
The industrials sector encompasses a variety of companies involved in manufacturing, transportation, and infrastructure. It has shown steady growth, supported by infrastructure investments.
Consumer Discretionary
The consumer discretionary sector includes retail and consumer goods companies. This sector has gained traction due to expectations of economic recovery and consumer spending.
Technology
The technology sector has emerged as a growth driver, particularly with advancements in AI and digital transformation. Companies like Shopify are leading this charge.
Real Estate
The real estate sector focuses on property management and development, with a growing emphasis on ESG (Environmental, Social, and Governance) criteria.
Utilities
The utilities sector provides essential services and tends to be more stable, making it a defensive investment during market volatility.
Healthcare
The healthcare sector includes pharmaceutical and biotechnology companies. It remains resilient, particularly with innovations in treatments and medical technologies.
This diverse sector composition reflects the overall health and dynamics of the Canadian economy, with various sectors contributing to the index’s performance.
Written with the help of AI and reviewed by an editor.
_____________
Technical Analysis is about trading with the trend
Note: This technical analysis is for educational purposes. Please conduct your own analysis or consult a financial advisor before making investment decisions. The author of this article may hold long or short positions in the featured stocks or indexes.
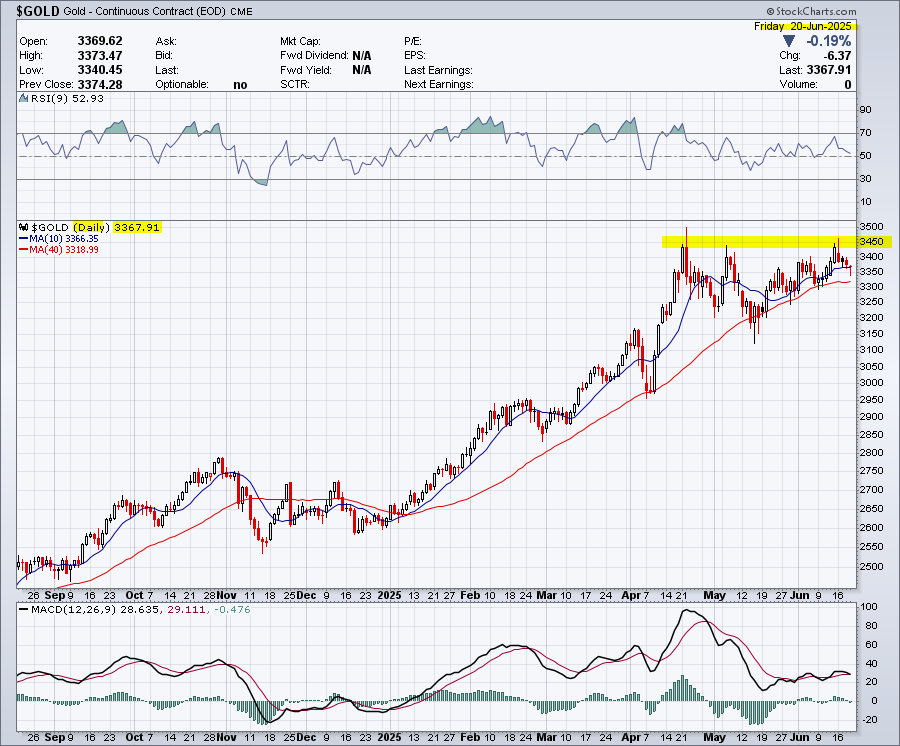
Analysis: Gold has tested the 3450 price zone three times. Monitor the consolidation zone for a breakdown below major support around 3150. Divergence is also apparent in the RSI indicator and MACD.
_____________
Technical Analysis is about trading with the trend
Note: This technical analysis is for educational purposes. Please conduct your own analysis or consult a financial advisor before making investment decisions. The author of this article may hold long or short positions in the featured stocks or indexes.
We use cookies to ensure that we give you the best experience on our website. If you continue to use this site we will assume that you are happy with it.