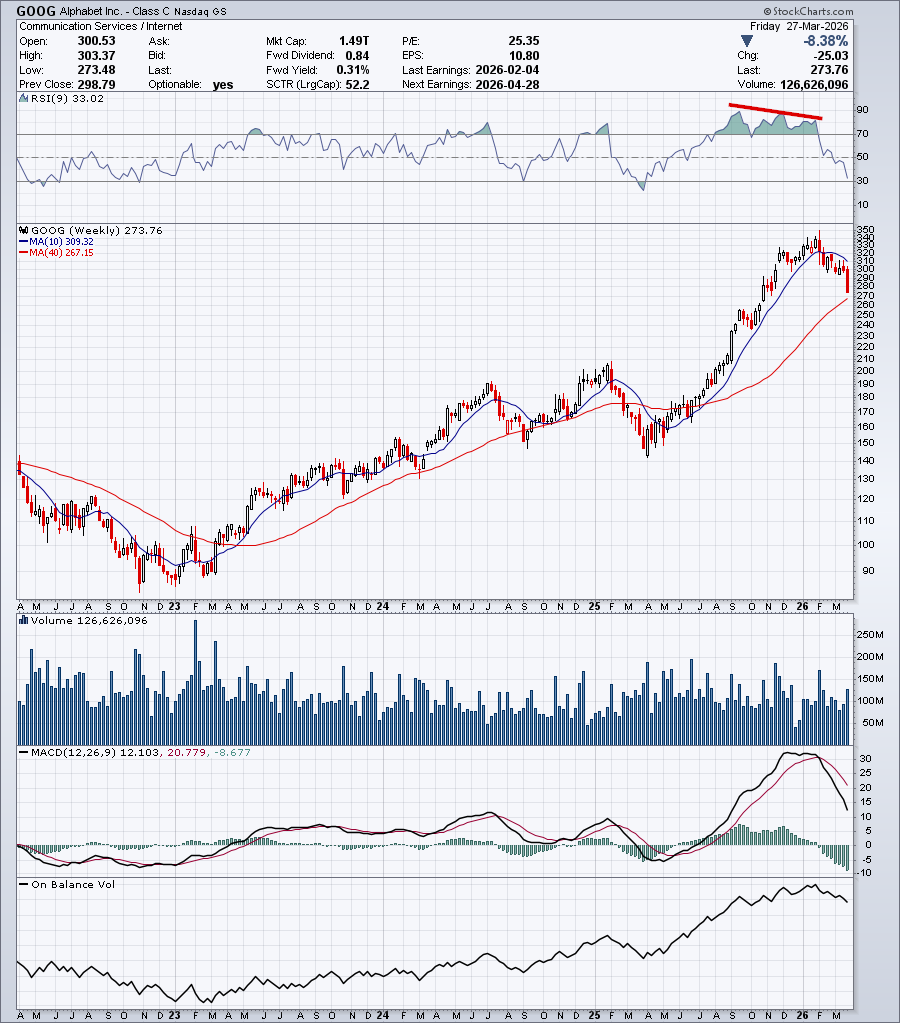
Analysis: This is an educational rear-view mirror post. What was an early indicator of the impending short-term downtrend? You can see the negative divergence on the RSI indicator as a early warning of the short-term downtrend. Can Google hold major support around the 200-day moving average? I say yes, but the market will have the finale say. We can easily be trumped.
_____________
Technical Analysis is about trading with the trend
Note: This technical analysis is for educational purposes. Please conduct your own analysis or consult a financial advisor before making investment decisions. The author of this article may hold long or short positions in the featured stocks or indexes. The article was written with the help of AI and was reviewed by an editor.
© 2026 TradeOnline.ca InvestOnline.ca ChartAnalysis.ca