Published by Reuters April 9, 2026
My comments: This is most likely the tip of the iceberg. None will be prosecuted. The Trump team has undermined the integrity of the whole financial system.
By Utkarsh Shetti
April 9 (Reuters) – Some of U.S. President Donald Trump’s major policy decisions have been preceded by well-timed bets, leading some experts to raise questions about whether information had somehow leaked ahead of time.
Here is a list.
April 7, 2026 – IRAN CEASEFIRE ANNOUNCEMENT:
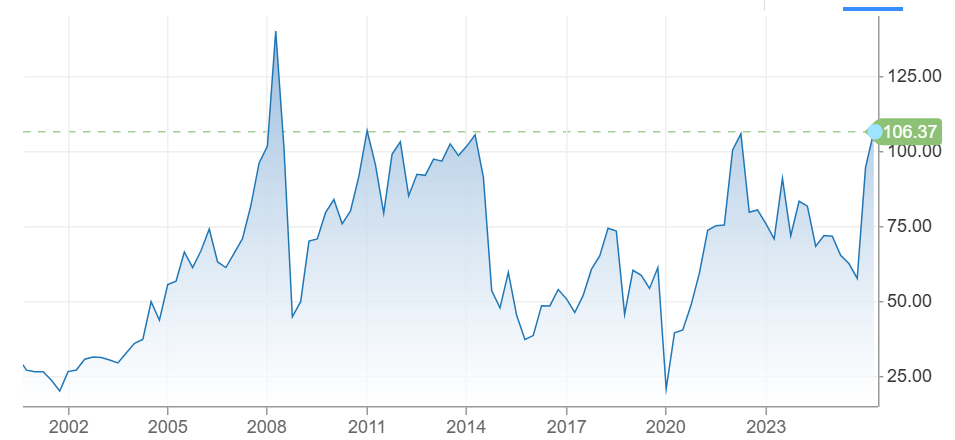
Traders placed a roughly $950 million bet on oil prices falling just hours before the announcement of a ceasefire between the U.S. and Iran.
A combined 8,600 lots of Brent and U.S. crude futures were sold at 1945 GMT on Tuesday, according to LSEG data. At around 2230 GMT, Trump announced a two-week ceasefire with Iran, knocking crude futures down by some 15% to below $100 a barrel at the start of Wednesday’s official trading session.
Separately, the Associated Press reported that a group of new accounts on prediction market platform Polymarket made timely bets on whether a ceasefire would be reached on April 7. Prediction markets offer tradable yes-or-no contracts that let users wager on a broad array of real-world events.
The news agency cited publicly available blockchain data from Polymarket using crypto analytics platform Dune, which showed at least 50 accounts, or wallets, placed “Yes” bets before Trump’s post.
One wallet, created around 10 am ET on the same day, profited $200,000 after betting roughly $72,000, while another user joined the platform on April 6 and won $125,500. A third wallet was created just 12 minutes before Trump’s announcement, raking in an estimated $48,500 after betting $31,908.
Polymarket did not respond to a Reuters request for comment.
March 23, 2026 – IRAN ATTACK PAUSE:
An unidentified trader or traders bet $500 million on Brent and WTI crude futures in a one-minute period shortly before Trump announced a five-day delay to attacks on Iran’s energy infrastructure, after which oil prices crashed 15%, exchange data and Reuters calculations showed.
LSEG data shows 5,100 lots changed hands between 1049 and 1050 GMT, with selling dominating volume. When Trump’s social media post announcing the move hit at 1105 GMT, over 13,000 lots — equivalent to 13 million barrels — traded in 60 seconds, causing Brent to fall to $99 per barrel from $112 and sending WTI down to $86 per barrel from $99.
February 28, 2026 – IRAN STRIKES THAT KILLED SUPREME LEADER AYATOLLAH ALI KHAMENEI
Wagers placed on platforms including Polymarket before the killing of Iranian Supreme Leader Ayatollah Ali Khamenei intensified scrutiny of prediction markets, with Democratic lawmakers calling for a ban on bets tied to military actions that could reward those with privileged information. Kalshi is facing a lawsuit for failing to pay $54 million to people who bet that Khamenei would leave office before March 1. The company says it does not offer markets that settle on death.
According to a Reuters review of Polymarket’s website at the time, about $529 million was wagered on a range of contracts tied to the timing of U.S.-Israeli strikes on Iran, while another $150 million was staked on Khamenei’s removal as supreme leader.
Analytics firm Bubblemaps identified six accounts that made a combined $1.2 million profit from Polymarket bets that were funded in the hours immediately before the raids, which took place on February 28. U.S. Representative Mike Levin of California flagged one specific Polymarket bet placed shortly before the Iran strikes.
Separately, despite hotter-than-expected inflation data that would typically prompt investors to sell long-dated Treasuries, traders moved in the opposite direction on February 27, pushing yields on the benchmark 10-year note below 4%. Analysts said such a pronounced shift into the safe-haven asset would usually be driven by a negative macro event – or a strong expectation that one was imminent.
Shares of U.S. airlines also fell that day as oil prices rose, with the Dow Jones U.S. Airlines Index slipping 5.13%.
January 3, 2026 – U.S. CAPTURE OF FORMER VENEZUELAN PRESIDENT NICOLAS MADURO:
An unknown trader pocketed a profit of roughly $410,000 after wagering on the ouster of Venezuelan President Nicolas Maduro in January.
The trader’s account on Polymarket built up positions in contracts tied to Maduro’s removal on terms that implied long odds before the weekend raid of Maduro’s compound in Caracas by U.S. special forces. Those wagers, worth about $34,000 prior to his capture, surged in value after news of the U.S. military operation emerged on January 3.
April 9, 2025 – TARIFF PAUSE:
Unidentified options traders staked millions of dollars on a U.S. stock market rebound in the minutes before Trump’s tariff pause announcement triggered a massive rally in April last year, according to trading data.
Trump’s Truth Social post pausing tariffs came at 1:18 p.m. ET on April 9, setting off a 9.5% jump for the S&P 500. Market data shows certain options contracts logging a spike in trading activity ahead of it. Some 5,105 SPY call options traded at around 1 p.m. ET for an average price of $4.20.
When stocks rallied, those calls soared as high as around $42, turning $2.14 million into about $21.44 million on paper.
Similarly, other SPY calls betting on the ETF rising above $509 traded at around 1:10 p.m. ET; their value jumped to about $10 million by end of day, up from $624,000.
Reuters could not determine whether the calls were all purchased or sold by one trader or several and whether they closed the position for a gain.
White House spokesman Kush Desai said government ethics guidelines bar federal employees from profiting off nonpublic information. “Any implication that Administration officials are engaged in such activity without evidence is baseless and irresponsible,” he said in an email statement.
Some trades ahead of Trump policy moves raise questions By Reuters