Published January 2, 2026
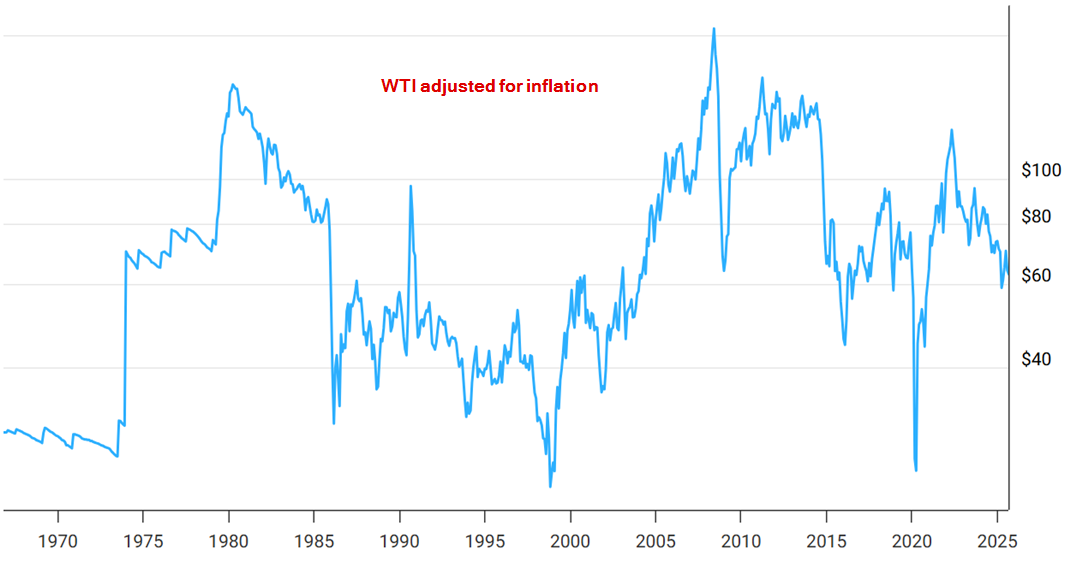
As of January 2, 2026, the price of WTI Crude Oil is approximately $57.50 USD per barrel. The price of oil shown in the chart is adjusted for inflation using the headline CPI and is shown by default on a logarithmic scale.
1. The Era of Cheap Oil (1968–1972)
Before the formation of OPEC as a political force, oil prices were remarkably stable and controlled largely by the “Seven Sisters” (major US/European oil companies).
- 1968 Price: ~$3.00
- Context: Oil was abundant and cheap. The US was the world’s swing producer, and prices rarely moved more than a few cents.
2. The Oil Shocks (1973–1985)
Everything changed in the 1970s when control of pricing shifted from Western companies to Middle Eastern nations.
- 1973 (The First Shock): Prices tripled from $4 to $12 following the Arab Oil Embargo (Yom Kippur War).
- 1979 (The Second Shock): Prices doubled from $15 to $39.50 following the Iranian Revolution.
- 1980 Peak: Reached an inflation-adjusted high that wouldn’t be beaten until 2008.
3. The Great Collapse & The “Lost Decade” (1986–1999)
A massive oversupply (the “Glut”) caused prices to crash, leading to a long era of cheap energy.1
- 1986 Crash: Saudi Arabia tired of cutting production and flooded the market.2 Prices collapsed from $30 to $10 in roughly four months.
- 1990 Spike: Briefly hit $40 during the Gulf War (Iraq/Kuwait) but quickly fell back.3
- 1998 Low: The Asian Financial Crisis crushed demand, sending oil down to $11.90 per barrel.
4. The “Supercycle” (2000–2014)
Driven by the industrialization of China and India, demand exploded.4
- 2000-2007: steady climb from $25 to $90.
- 2008 Peak: WTI hit its all-time record of $147.27 in July 2008.
- 2008 Crash: The Global Financial Crisis sent it crashing down to $33 by December.
- 2011–2014: The “Hundred Dollar Era.” Prices stabilized over $100 for nearly three years due to the Arab Spring.
5. The Shale Revolution & COVID (2015–2021)
US Fracking technology flooded the market with new supply, breaking OPEC’s grip.
- 2014 Crash: Prices fell from $107 to $50 as OPEC refused to cut production to fight US shale.5
- 2020 (The Anomaly): During the pandemic lockdowns, demand vanished. On April 20, 2020, WTI futures briefly traded at negative -$37.63 (traders paid people to take the oil).
6. The War & The Correction (2022–2026)
- 2022 High: Russia’s invasion of Ukraine sent prices back to $123.
- 2023–2024: Prices slowly ground lower as interest rates rose and US production hit record highs.
- Late 2025/Early 2026: Prices have softened significantly to the $57–$60 range due to fears of oversupply and weak demand from China.6
Summary Table (Approx. Annual Averages)
| Year | Price (Nominal) | Key Event |
| 1968 | $3.07 | Pre-OPEC stability |
| 1974 | $9.35 | Post-Embargo |
| 1980 | $37.42 | Iranian Revolution peak |
| 1986 | $15.10 | The Price Collapse |
| 1998 | $14.42 | Asian Financial Crisis |
| 2008 | $99.67 | The Supercycle Peak (Hit $147 intraday) |
| 2016 | $43.29 | Shale Oil Flood |
| 2022 | $94.53 | Ukraine War |
| 2026 | $57.50 | Current (Jan 3) |
https://www.macrotrends.net/1369/crude-oil-price-history-chart