Published July 4, 2026
It was characterized by a rapid post-pandemic surge, a difficult inflationary correction, and a subsequent AI-driven rally.
S&P 500 Performance Summary (2021–2026)
| Year | Total Return | Key Market Drivers |
| 2021 | +28.71% | Massive fiscal stimulus, ultra-low interest rates, and the reopening of the global economy after the pandemic. |
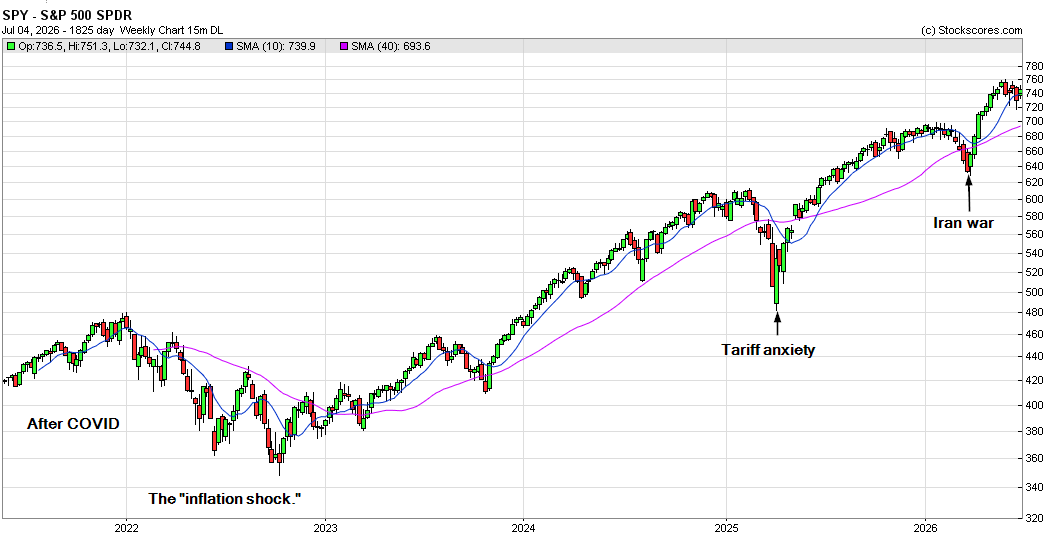
| 2022 | -18.11% | The “inflation shock.” Rapid interest rate hikes by the Fed, the Ukraine conflict, and a bear market in both stocks and bonds. |
| 2023 | +26.29% | The “AI breakout.” Enthusiasm for generative AI fueled the “Magnificent 7,” and the economy proved resilient despite high rates. |
| 2024 | +25.02% | Continued AI expansion and high corporate earnings; markets benefited from a “soft landing” narrative. |
| 2025 | +17.88% | Fundamentals-driven growth. Gains were led by earnings growth rather than valuation expansion; strong market concentration in mega-caps. |
| 2026 (YTD) | ~+10.0% | Volatility driven by the U.S./Israel-Iran conflict and energy price spikes, balanced by continued tech/semiconductor leadership. |
Detailed Year-by-Year Context
- 2021: The Post-COVID Recovery: Markets thrived on the massive liquidity provided by central banks and government stimulus. Low interest rates made stocks highly attractive, leading to a broad rally across almost all sectors.
- 2022: The Inflationary Reset: This was a outlier year where traditional “hedges” failed. Persistent, high inflation forced the Federal Reserve to embark on a rapid cycle of interest rate hikes. This crushed growth-heavy tech stocks and increased bond yields, resulting in a rare, simultaneous decline in both equities and fixed-income assets.
- 2023: The Artificial Intelligence Surge: Investors largely ignored the recession warnings that dominated headlines at the start of the year. The primary driver was the massive investment in AI infrastructure, specifically benefiting the largest technology companies (the “Magnificent 7”).
- 2024: Stability and Scaling: The momentum from 2023 continued. The primary narrative shifted to whether the U.S. could achieve a “soft landing” (lowering inflation without triggering a recession), which ultimately bolstered investor confidence and sustained high index returns.
- 2025: Fundamentals over Sentiment: Unlike the prior years, which were often fueled by enthusiasm for AI, 2025 was marked by actual earnings growth. While market leadership remained narrow—concentrated heavily in a small group of large-cap tech and semiconductor firms—the price gains were more directly tied to corporate bottom lines.
- 2026 (First Half): Geopolitical Volatility: The first half of 2026 was defined by the outbreak of the U.S./Israel-Iran conflict. The resulting closure of the Strait of Hormuz caused a massive spike in energy prices in March, leading to a sharp market drawdown. However, markets have shown resilience since then, supported by persistent demand for semiconductor compute power and expectations that the U.S. Fed is better positioned than global counterparts to manage the economic fallout.
Note: Returns shown are annual total returns (price change plus dividends). Data for 2026 reflects year-to-date performance as of early July 2026.
_____________
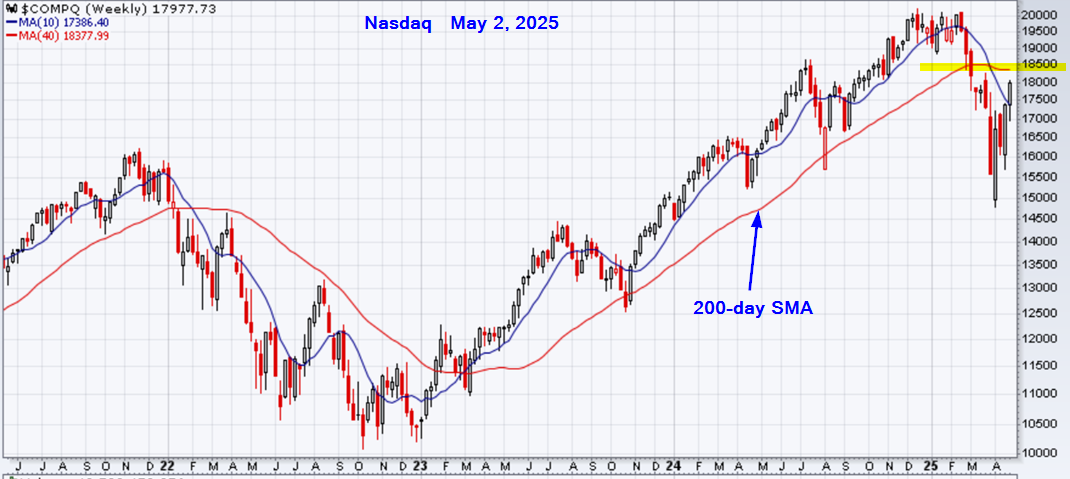
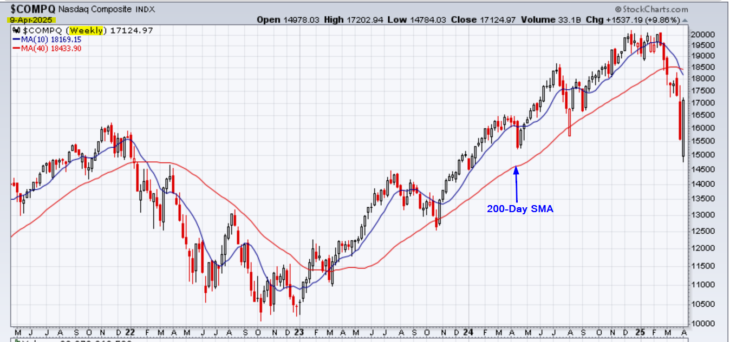
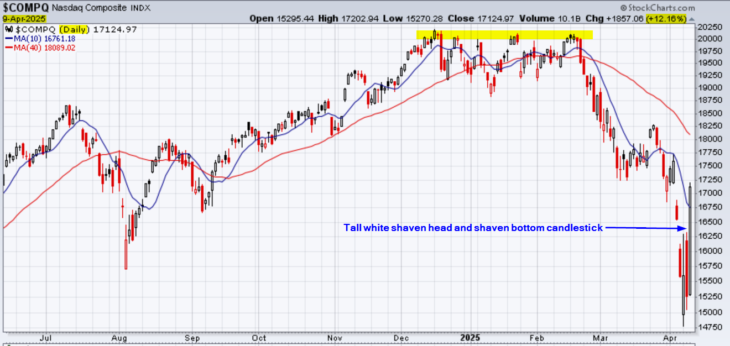
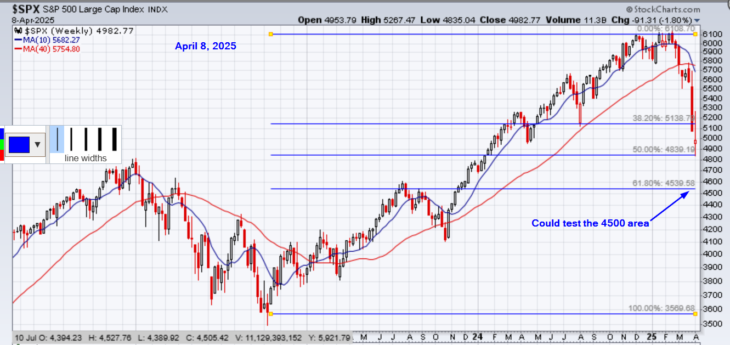
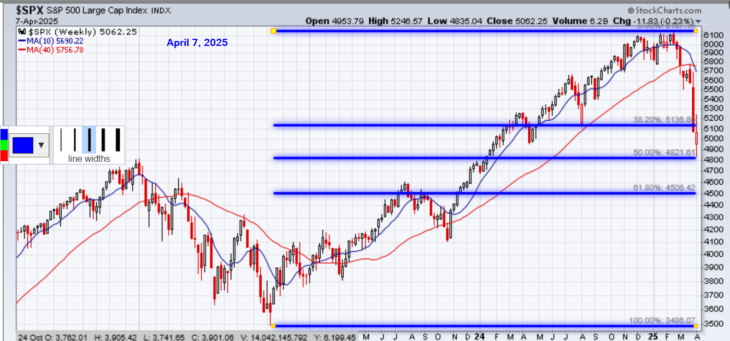
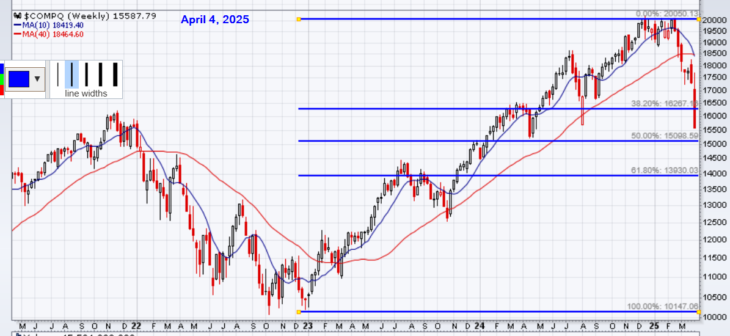
Technical Analysis is about trading with the trend
Note: This technical analysis is for educational purposes. Please conduct your own analysis or consult a financial advisor before making investment decisions. The author of this article may hold long or short positions in the featured stocks or indexes. The article was written with the help of AI and was reviewed by an editor.
© 2026 TradeOnline.ca InvestOnline.ca ChartAnalysis.ca