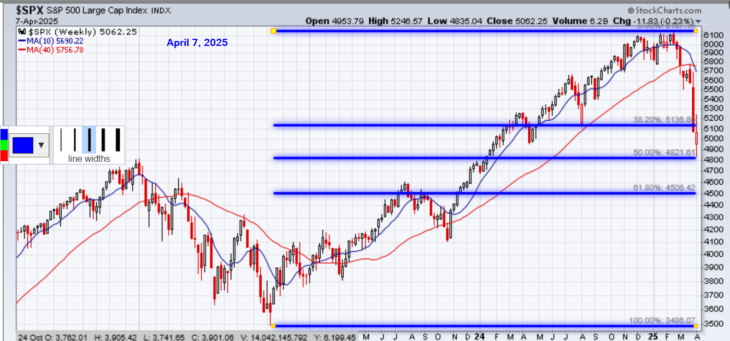
The SP 500 Index is down around 18% from the high. It is attempting to hold support around the 50% retracement level. If it breaks the 50% retracement level, the S&P 500 will test support around 4500 and be firmly in bear territory. We can see the death cross as the 50 day is trading below the 200 day simple moving average. The overall appearance of this chart is negative.
https://www.investopedia.com/terms/d/deathcross.asp
_____________
Technical Analysis is about trading with the trend
Note: This technical analysis is for educational purposes. Please conduct your own analysis or consult a financial advisor before making investment decisions. The author of this article may hold long or short positions in the featured stocks or indexes.
© 2025 TradeOnline.ca