His first year back in office was the most profitable of his life, bestowing US$3-billion in wealth on the family fortune, according to Forbes.
Mr. Trump’s self-enrichment campaign comes at a cost to us all. It rips off those on the other side of those trades. And it undermines the fairness of the public markets.
In March, more than US$800-million worth of oil futures changed hands just minutes before Mr. Trump announced on Truth Social that strikes on Iran’s infrastructure would be postponed, according to the Wall Street Journal.
Same thing a couple weeks ago, as detailed by the influential market commentator The Kobeissi Letter. In the early hours of May 6, someone bet nearly US$1-billion on crude oil shorts, which pay off if the price of oil drops. About an hour later, Axios reported that a deal to end the war in Iran was in the works. Oil prices quickly dove by 12 per cent, and those shorts netted a cool US$125-million.
As of April 2026, the global fiscal landscape is defined by a push-and-pull between high defense spending, massive AI infrastructure investment, and impact of elevated energy prices.
The following table ranks the G20 major economies by their projected general government budget balance (net lending/borrowing) as a percentage of GDP for the 2026 fiscal year. Countries with the highest negative percentages represent the largest deficits.
Fiscal Deficit Ranking: Major World Economies (2026 Projection)
Rank
Economy
Deficit/Surplus (% of GDP)
Primary Fiscal Drivers
1
China
-8.2%
Infrastructure stimulus and property sector support.
2
Brazil
-7.7%
Social spending and high debt-servicing costs.
3
India
-7.4%
Continued heavy capital expenditure on infrastructure.
4
United States
-5.8%
Rising mandatory spending and net interest outlays.
5
France
-4.9%
Energy transition subsidies and defense modernization.
6
South Africa
-4.9%
Support for state-owned enterprises and power grid.
7
United Kingdom
-3.9%
Public service funding and debt interest volatility.
8
Germany
-3.8%
Defense “Zeitenwende” and industrial energy support.
9
Saudi Arabia
-3.5%
Vision 2030 mega-projects and oil price volatility.
10
Mexico
-3.5%
Social programs and Pemex financial support.
11
Turkey
-3.4%
Earthquake reconstruction and inflation mitigation.
12
Indonesia
-2.9%
New capital city (Nusantara) development.
13
Italy
-2.8%
Phasing out of “Superbonus” construction incentives.
14
Canada
-2.7%
Provincial healthcare transfers and housing initiatives.
15
Australia
-2.4%
Transitioning back to deficit as commodity prices ease.
16
Japan
-2.0%
Demographic-driven social costs vs. tax revenue growth.
17
Russia
-2.0%
Sustained military expenditures.
18
South Korea
-1.5%
Semiconductor subsidies and aging population costs.
19
Argentina
+0.5% (Surplus)
Strict fiscal austerity and subsidy removals.
20
Singapore
+3.3% (Surplus)
High corporate tax revenue and prudent reserve policy.
Key Macro Trends for 2026
The Interest Burden: For advanced economies like the United States and France, net interest payments are consuming an increasing share of GDP. Projections show US interest costs reaching 3.5% of GDP this year, nearly equal to its defense budget.
Defense & Technology: In Europe, the -3.8% to -4.9% deficits are increasingly driven by a permanent shift in defense spending targets (approaching 2.5% to 3.0% of GDP). Globally, fiscal incentives for AI and semi-conductors have become a “baseline” expenditure for major economies.
The Austerity Exception:Argentina remains a notable outlier, shifting from a deep deficit to a marginal surplus following radical fiscal restructuring, though this has come at the cost of significantly suppressed domestic consumption.
Following the fiscal deficit projections, the general government gross debt-to-GDP ratio provides a clearer picture of the total accumulated debt relative to each country’s economic output.
As of April 2026, debt levels remain elevated across advanced economies due to high interest rates and the expansion of industrial and defense subsidies. The following table ranks the G20 major economies by their projected debt-to-GDP ratios for the 2026 fiscal year, based on the latest IMF World Economic Outlook data.
Public Debt-to-GDP Ranking: Major World Economies (2026)
Rank
Economy
Debt-to-GDP (%)
Context & Fiscal Drivers
1
Japan
230.1%
Decades of stimulus and an aging population.
2
Singapore
172.5%
High, but primarily used for sovereign investment.
3
Italy
137.4%
Persistent structural debt and high servicing costs.
4
United States
125.8%
Rising interest outlays and mandatory spending.
5
France
118.4%
Post-pandemic recovery spending and defense.
6
Canada
114.2%
High household and provincial-level debt.
7
United Kingdom
103.6%
Elevated public service spending vs. slow growth.
8
Spain
98.2%
Gradual deleveraging from pandemic-era peaks.
9
China
96.3%
Rapid rise due to local government and property support.
10
Euro Area (Avg)
87.8%
Broad regional average across EU member states.
11
Brazil
84.5%
High social expenditure and borrowing costs.
12
India
81.9%
Heavy infrastructure spending to fuel 6.5% growth.
13
Argentina
78.4%
Down from previous highs due to strict austerity.
14
South Africa
77.1%
State-owned enterprise support (Energy/Transport).
15
Germany
64.0%
Constrained by the constitutional “debt brake.”
16
South Korea
54.4%
Increasing support for semiconductor and tech R&D.
17
Australia
51.3%
Strong commodity exports helping offset debt.
18
Mexico
45.4%
Disciplined fiscal policy relative to regional peers.
19
Saudi Arabia
32.1%
Low debt, but rising due to “Vision 2030” projects.
20
Russia
19.1%
Heavily sanctioned and isolated from global markets.
Critical Observations
The $100% Threshold: A majority of the G7 nations (Japan, Italy, US, France, Canada, UK) are now operating with debt levels exceeding 100% of their GDP. This creates a “fiscal squeeze” where a growing portion of tax revenue must be diverted to pay interest rather than funding infrastructure or services.
The “Investment” Outlier:Singapore remains the exception to the rule. Unlike other nations, its debt is not used to fund budget deficits but is instead issued to provide a pool of assets for the Central Provident Fund and for reinvestment by its sovereign wealth funds (GIC/Temasek).
China’s Trajectory: China has seen one of the fastest debt increases in the G20, rising from roughly 60% in 2019 to over 96% today, as the central government absorbs the liabilities of local governments and the struggling property sector.
Note: Published with the assistance of AI and reviewed by an editor.
You have two distinct options here: betting against the Oil Companies (Stocks) or betting against the Price of Oil (Commodity).
Strategy
New Ticker
Old Ticker
Fund Name
Short Oil STOCKS
NRGD
(HED)
BetaPro S&P/TSX Capped Energy -2x Daily Bear
Short Oil PRICE
HOD
(Kept Ticker)
BetaPro Crude Oil Inverse Leveraged Daily Bear
Short Nat Gas
HND
(Kept Ticker)
BetaPro Natural Gas Inverse Leveraged Daily Bear
Crucial Distinction:
Buy NRGD if you think Suncor/CNQ stocks will fall.
Buy HOD if you think the WTI Oil Price will fall. (HOD is extremely volatile and suffers from “decay” if held long-term).
3. Betting Against Canadian Banks
With the mortgage renewal cliff in 2026, this is a popular trade for those bearish on the housing market.
Strategy
New Ticker
Old Ticker
Fund Name
-2x Bank Bear
CFOD
(HFD)
BetaPro S&P/TSX Capped Financials -2x Daily Bear
4. Betting Against US Tech (TSX Listed)
Many Canadians use their CAD accounts to short the US market without converting currency.
Strategy
New Ticker
Old Ticker
Fund Name
Short S&P 500
SPXD
(HSD)
BetaPro S&P 500 -2x Daily Bear ETF
Short NASDAQ
QQD
(HQD)
BetaPro NASDAQ-100 -2x Daily Bear ETF
⚠️ Critical Warning: The “Daily Reset” Trap
These ETFs are not long-term investments.1 They are designed for 1-day trades.
The Decay: Because they reset their leverage every single day, holding them for weeks or months will erode your value, even if the market goes in your direction.2
Example: If the market is flat but volatile (up 2% one day, down 2% the next), you will lose money in both the Bull (+2x) and Bear (-2x) funds over time.
Rule of Thumb: Do not hold these tickers (especially the -2x ones like CNDD or HOD) for longer than a few days unless you are actively managing the position.
Yes, CNDI (BetaPro S&P/TSX 60 Daily Inverse ETF) does decay.
Even though it is only -1x (Single Inverse) and not -2x like the riskier funds, it still suffers from “Volatility Drag” because of its daily reset mechanism.
If you hold CNDI for more than one day in a choppy market, you are mathematically guaranteed to lose value over time, even if the TSX 60 ends up flat.
The Math: How the “Daily Reset” Eats Your Money
To understand why it decays, look at this simple 2-day scenario where the market goes Up one day and Down the next, ending back where it started.
Scenario: The “Choppy” Market
Imagine the TSX 60 Index starts at $100.
Day 1: The Market goes UP 10%.
Day 2: The Market goes DOWN 9.09% (this brings it exactly back to $100).
Here is what happens to your CNDI shares:
Day
Market Action
CNDI Action (Inverse)
Your CNDI Value
Start
Index at $100
Buy at $100
$100.00
Day 1
Market +10% (to $110)
CNDI -10%
$90.00
Day 2
Market -9.09% (back to $100)
CNDI +9.09%
$98.18
Result
Market is FLAT ($0 change)
You LOST ~$1.82
-1.8% Loss
The Decay: The market did nothing (returned to zero), but you lost nearly 2% of your money. This is because losing 10% hurts you more than gaining 9% helps you. You are trying to recover from a smaller base ($90 instead of $100).
Why CNDI Decays Slower than CNDD (-2x)
While CNDI decays, it is much safer than the -2x leveraged version (CNDD). Decay essentially “squares” with leverage.
CNDI (-1x): Moderate Decay (Dangerous over months).
CNDD (-2x): Rapid Decay (Dangerous over weeks).
Summary Rule
Use CNDI for: A trade lasting 1 day to 2 weeks when you are confident the market will drop in a straight line.
Do NOT use CNDI for: A long-term “hedge” against a recession. If the market grinds sideways for 6 months before crashing, your CNDI shares will have already decayed significantly, and you won’t get the full protection you expected.
Better Hedge: If you need protection for 6+ months, it is often cheaper to buy Put Options on the TSX 60 (XIU) rather than holding an inverse ETF that bleeds value daily.
_____________
Technical Analysis is about trading with the trend
Note: This technical analysis is for educational purposes. Please conduct your own analysis or consult a financial advisor before making investment decisions. The author of this article may hold long or short positions in the featured stocks or indexes. The article was written with the help of AI and was reviewed by an editor.
The MAGA movement, short for “Make America Great Again,” is a political movement in the United States that emerged during Donald Trump’s 2016 presidential campaign. It is characterized by a right-wing populist ideology that emphasizes American nationalism and traditional values.
Key Features
Origin: The slogan “Make America Great Again” was first popularized by Ronald Reagan in 1980 but was rebranded by Trump in 2012 for his political campaigns.
Core Beliefs: The movement advocates for:
Economic protectionism
Reduced immigration
“America First” policies
A return to what supporters view as traditional American values
Cultural Impact: The MAGA slogan became a cultural phenomenon, leading to various merchandise, including the iconic red hats. It has also inspired numerous parodies and derivative slogans.
Political Influence
Elections: The MAGA movement played a crucial role in Trump’s victories in the 2016 and 2020 elections, energizing a significant base of supporters.
Controversies: The movement has faced criticism for its perceived exclusionary rhetoric and has been labeled by some as extremist. It has also been associated with events like the January 6 Capitol attack, which some members initially downplayed.
Recent Developments
Continued Relevance: The MAGA movement remains influential in American politics, with ongoing discussions about its future and impact on the Republican Party. Variants like “Dark MAGA” have emerged, advocating for a more aggressive approach to Trumpism.
The MAGA movement continues to shape political discourse in the U.S., reflecting deep divisions in contemporary American society.
Published with the help of AI and reviewed by an editor
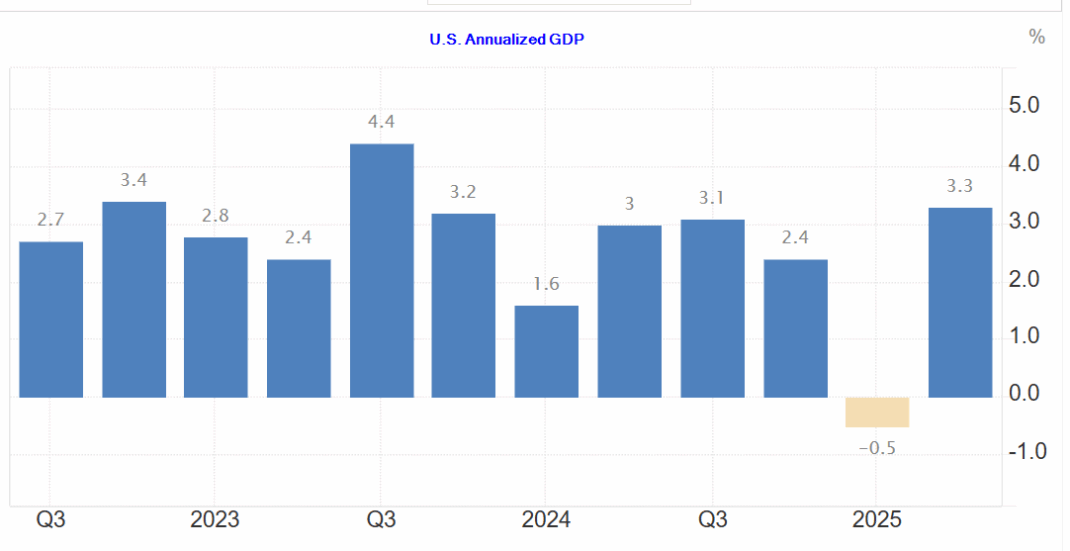
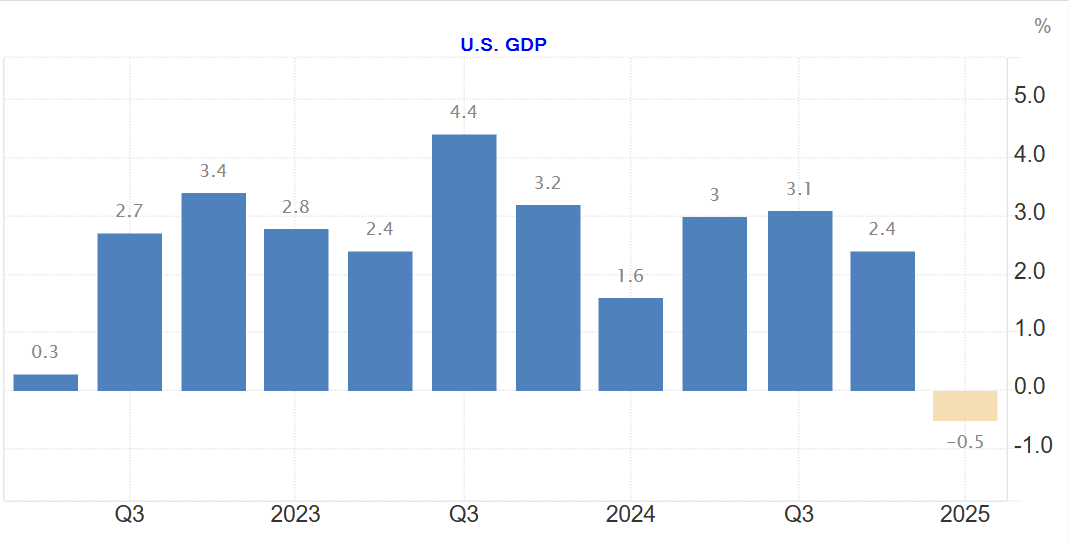
The most recent data from the U.S. Bureau of Economic Analysis (BEA) shows that the U.S. economy’s real Gross Domestic Product (GDP) grew at a strong rate in the second quarter of 2025.
Key Figures (Q2 2025)
Real GDP Growth Rate: The U.S. real GDP increased at an annual rate of 3.3% in the second quarter of 2025 (April, May, and June). This was an upward revision from the initial estimate of 3.0% and represents a significant rebound from the 0.5% decrease in the first quarter of the year.
Nominal GDP: The nominal, or current-dollar, GDP for the second quarter was $30.33 trillion.
Key Drivers of Growth
The increase in real GDP in the second quarter primarily reflected:
Increased Consumer Spending: An acceleration in personal consumption expenditures was a major factor, with Americans spending more on both goods and services.
Decreased Imports: A notable downturn in imports contributed to the GDP increase, as imports are a subtraction in the GDP calculation. This was partly a result of businesses and consumers having stockpiled goods in the first quarter in anticipation of new tariffs.
Outlook and Forecast
While the second quarter saw robust growth, the outlook for the rest of 2025 and 2026 is somewhat mixed, with many forecasters predicting a slowdown.
Forecasts: According to forecasts from organizations like the Federal Reserve Bank of Philadelphia and EY, real GDP growth is expected to decelerate in the second half of 2025 and into 2026. This is largely due to the anticipated impact of trade barriers and a cautious consumer environment.
GDPNow: The Atlanta Fed’s GDPNow model currently projects a slower growth rate for the third quarter of 2025, with an estimate of 2.2%. This forecast is updated regularly based on incoming economic data.
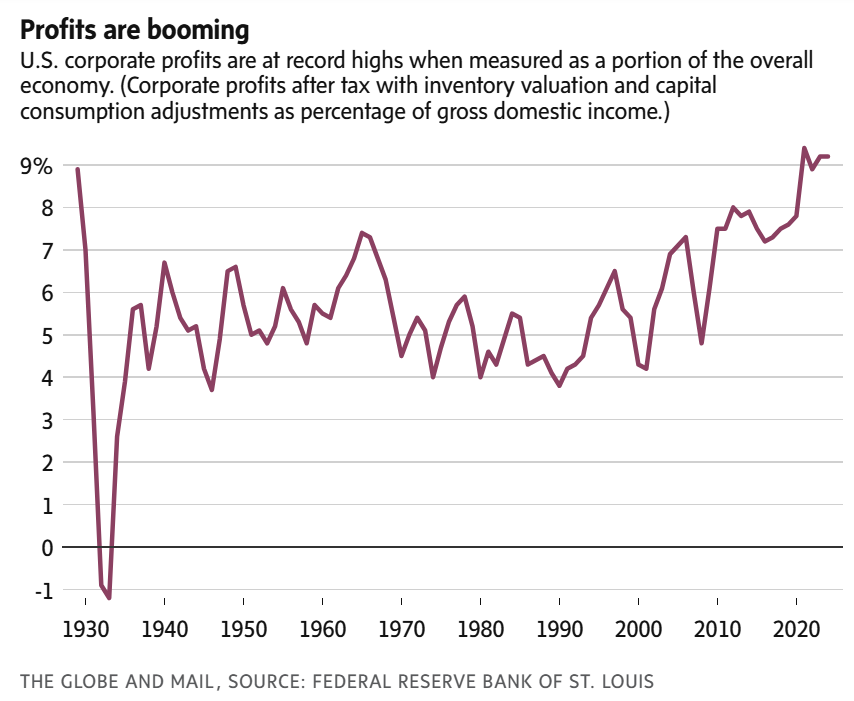
Analysis: First-quarter growth sank under a surge of imports as companies in the United States rushed to bring in foreign goods before Trump could impose tariffs on them. Trade deficits reduce GDP. But that’s just a matter of mathematics. GDP is supposed to count only what’s produced domestically, not stuff that comes in from abroad. So imports – which show up in the GDP report as consumer spending or business investment – have to be subtracted out to keep them from artificially inflating domestic production.
The first-quarter import influx likely won’t be repeated in the April-June quarter and therefore shouldn’t weigh on GDP. In fact, economists expect second-quarter growth to bounce back to 3 per cent in the second quarter, according to a survey of forecasters by the data firm FactSet.
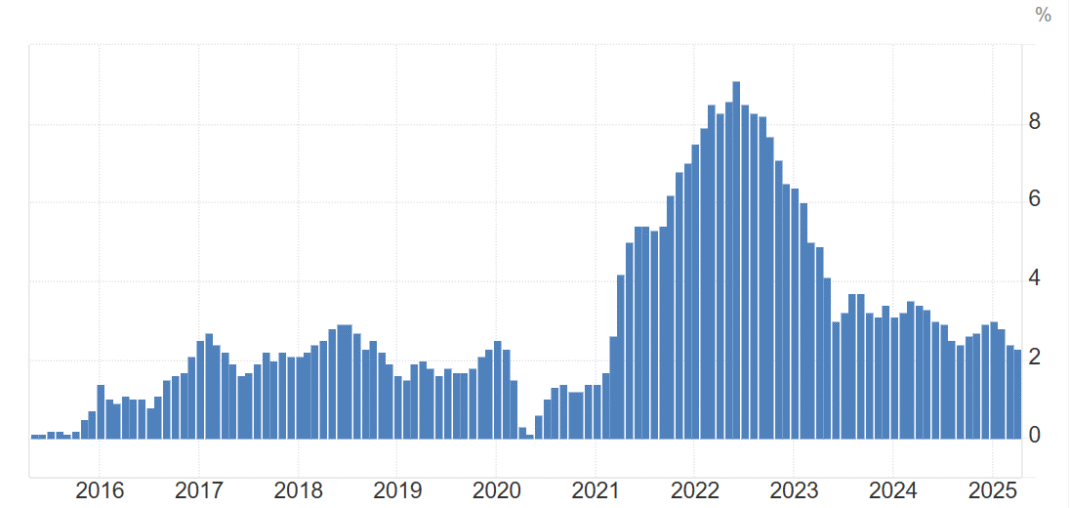
Analysis: The target rate is 2.00% and most likely a lag before we see the effect of tariffs that will be passed on to the U.S. consumer.
Here is a 10-year chart:
We use cookies to ensure that we give you the best experience on our website. If you continue to use this site we will assume that you are happy with it.