Category Archives: Stocks

As NVIDIA (NVDA) hovers around a $5.5 trillion market cap, its valuation presents a fascinating paradox

Published May 20, 2026

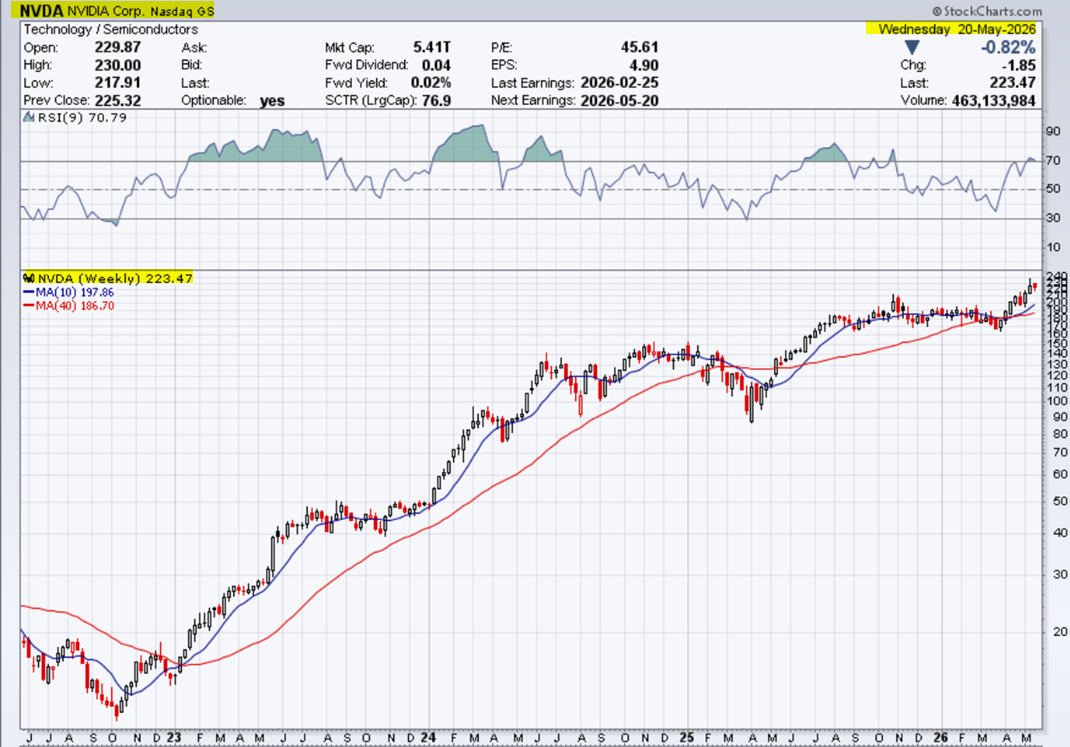
As NVIDIA (NVDA) hovers around a $5.5 trillion market cap—trading in the $220 to $225 range—its valuation presents a fascinating paradox. While it remains one of the most valuable companies in the world, its valuation multiples have quietly compressed to near-historical lows relative to its massive earnings power.


1. Price-to-Earnings (P/E) Metrics

NVIDIA’s valuation looks drastically different depending on whether you look backward or forward.

  • Trailing P/E (LTM): ~42x – 45x Based on trailing twelve-month earnings, NVIDIA trades at roughly 43 times earnings. While this is a premium compared to the broader S&P 500 (average ~20x), it represents a monumental drop from the peak AI euphoria of 2023, when its trailing P/E routinely cleared 140x to 240x.
  • Forward P/E (NTM): ~25x – 27x Looking at expected earnings over the next 12 months, the multiple drops significantly. A forward P/E in the mid-20s places NVIDIA in line with—or even cheaper than—large-cap tech peers like Microsoft and Apple, and vastly cheaper than direct semiconductor rivals like AMD (which trades at a much higher trailing multiple due to lower absolute earnings).
Nvidia 4-year weekly chart

2. Historical Context: The “Compression” Story

NVIDIA is currently trading below its own long-term historical valuation averages.

  • Its 3-year average P/E sits at ~53x.
  • Its 5-year average P/E sits at ~63x.
  • Its 10-year historical average sits at ~64x.

Even before the generative AI boom, the market always commanded a premium for NVIDIA due to its gaming and crypto tailwinds. At ~42x trailing earnings today, the stock is being priced more like a mature, high-quality growth business rather than a speculative momentum trade.


3. Other Critical Valuation Metrics

Gross & Net Profit Margins (The Moat)

What prevents NVIDIA’s P/E from skyrocketing alongside its stock price is its unprecedented profitability.

  • Gross Margins: Sustaining at an incredible ~75%.
  • Net Profit Margins: Reached an extraordinary 71% in the most recent Q1 earnings report (Net Income of $58 billion on $82 billion in revenue).

PEG Ratio (Price/Earnings-to-Growth): ~0.6x – 1.0x

When factoring in growth, NVIDIA looks remarkably inexpensive. A PEG ratio below 1.0 traditionally indicates that a stock is undervalued relative to its growth rate. With Wall Street projecting aggregate earnings growth of over 70% for NVIDIA this fiscal year, its PEG ratio remains highly attractive.

Price-to-Sales (P/S) Ratio: ~22x

This remains NVIDIA’s most expensive metric. A P/S ratio above 20x is historically risky for hardware companies, but it reflects the absolute monopoly NVIDIA currently maintains over tier-one AI data center deployments (Blackwell and upcoming Rubin architectures).


4. The Valuation Debate: Hardware vs. “Tokenomics”

The primary disconnect between structural bulls and bears comes down to how you define NVIDIA’s business model:

The Bear Case (Hardware Cycle): Hardware multiples eventually mean-revert. Hyperscaler (Microsoft, Google, AWS) capex will eventually plateau, enterprise hardware cycles will turn, and competitive pressure from AMD or custom in-house silicon will erode those 75% gross margins.

The Bull Case (“Tokenomics” Factory): CEO Jensen Huang argues that framing NVIDIA as a “chip company” is structurally incorrect. In his view, modern AI data centers are not IT costs; they are manufacturing equipment. Instead of consuming power to run software, they are factories producing a highly valuable commodity: Tokens (text, code, synthetic data, and video).

5. What is Capping the Multiples?

If earnings are beating expectations (Q1 revenue grew 85% YoY), why are the multiples compressing?

  1. The China Hole: Direct export curbs have driven NVIDIA’s China data center revenue from $17.1 billion down to effectively zero, creating an onboarding headwind that the rest of the world has had to absorb.
  2. Macro Geopolitics: Broad market anxiety surrounding Middle East energy shocks and sustained inflation has kept a lid on broad tech multiple expansions, preventing NVDA from re-testing its historical 60x+ valuation heights.

https://investor.nvidia.com/financial-info/financial-reports/default.aspx

————-

Technical Analysis is about trading with the trend

Note: This technical analysis is for educational purposes. Please conduct your own analysis or consult a financial advisor before making investment decisions. The author of this article may hold long or short positions in the featured stocks or indexes. The article was written with the help of AI and was reviewed by an editor.

© 2026 TradeOnline.ca InvestOnline.ca ChartAnalysis.ca

Caterpillar (CAT) epitomizes the buy and hold strategy

Published May 3, 2026

This is not a tech stock. Caterpillar produces tractors.

Here is a chart from 1998. What was the annualized return if you held this stock from 1998?

https://www.caterpillar.com

————-

Technical Analysis is about trading with the trend

Note: This technical analysis is for educational purposes. Please conduct your own analysis or consult a financial advisor before making investment decisions. The author of this article may hold long or short positions in the featured stocks or indexes. The article was written with the help of AI and was reviewed by an editor.

© 2026 TradeOnline.ca InvestOnline.ca ChartAnalysis.ca

Will AI decimate these software stocks?

In early 2026, the software sector entered what analysts have dubbed the “SaaS-pocalypse.” The primary driver is a shift from “SaaS” (Software as a Service) to “AaaS” (Agents as a Service), where autonomous AI agents perform tasks that previously required human users to log into a dashboard.

This shift has created a “Seat Compression” crisis: if AI can do the work of five people, companies no longer need to pay for five software “seats” or licenses.


1. Customer Relationship Management (CRM) & Sales

These companies are at the center of the “seat compression” narrative because AI can now autonomously draft emails, update records, and qualify leads.

  • Salesforce (CRM): Despite launching Agentforce, Salesforce hit 52-week lows in February 2026. Investors fear that “AI Agents” will eventually eliminate the need for the thousands of human sales reps who currently use the platform.
  • HubSpot (HUBS): Similar to Salesforce, HubSpot has seen its valuation reset. While they have pivoted to a “usage-based” model to combat seat loss, the market remains skeptical that AI “credits” will fully replace the high margins of per-user subscriptions.
  • Zendesk (Private/Competitor): Though private, Zendesk is frequently cited in analyst notes as a “canary in the coal mine,” as AI chatbots now resolve over 70–80% of customer tickets without a human agent.

2. Creative & Design Software

The concern here is that generative AI allows non-experts to create professional-grade content, threatening the “pro-tool” moat.

  • Adobe (ADBE): Adobe hit a fresh 52-week low in April 2026. Despite its Firefly AI, investors are worried that specialized AI video tools (like OpenAI’s Sora or Luma) and “one-click” design platforms will erode Adobe’s dominance among creative professionals.
  • Unity (U): Facing competition from AI-driven game engines that can generate 3D environments from text, reducing the need for specialized developers and complex seat-based tooling.

3. Enterprise Workflow & IT Service Management (ITSM)

These platforms manage the “plumbing” of a company. AI is now “self-healing” many IT issues before a ticket is even created.

  • ServiceNow (NOW): Recently downgraded by major firms like UBS in April 2026. The threat is twofold: Salesforce’s Agentforce is directly attacking their IT service niche, and AI automation is reducing the human “troubleshooters” who use the platform.
  • Atlassian (TEAM): As mentioned in your earlier review, Atlassian faces “channel friction” as AI agents begin to automate project management and coding tasks (Jira/Confluence), potentially lowering the total headcount of developer teams.

4. Cybersecurity & Data Governance

AI has made “low-cost coding” possible, allowing startups to replicate complex security features that previously took years to build.

  • Varonis Systems (VRNS): Saw a significant stock drop in April 2026. Analysts are concerned that autonomous AI security systems could replace traditional data governance tools by managing permissions and threats in real-time without human intervention.
  • Okta (OKTA): Fears that AI-driven identity management will become a feature of the “operating system” or the cloud provider (Google/Microsoft), rather than a standalone software subscription.

5. Education Technology (EdTech)

This was the first sector to be hit by the “AI Replacement” concern.

  • Chegg (CHGG): After a brutal 2024 and 2025, Chegg is attempting to restructure into a “skilling” company. However, it continues to struggle as students turn to LLMs for instant, free tutoring rather than paying for Chegg’s proprietary database.
  • Duolingo (DUOL): Shares tumbled 24% in early April 2026 after the company projected lower-than-expected bookings. The concern is that AI-powered real-time translation (like Apple Intelligence or Google Translate) makes the long-term goal of “learning a language” less essential for many travelers.

Summary of the “2026 Bear Case”

Threat LevelIndustryPrimary Stock ImpactedThe AI “Replacement” Logic
CriticalEdTechChegg, DuolingoFree AI models replace paid proprietary content.
HighCRM / SalesSalesforce, HubSpotAI agents do the work, reducing “seat” counts.
MediumCreativeAdobeGenAI lowers the skill floor, commoditizing pro tools.
EmergingWorkflowServiceNow, AtlassianAutonomous IT “self-healing” reduces service tickets.

The Bottom Line: For these stocks to recover, they must prove they can monetize AI Outcomes (e.g., charging for a successfully resolved support ticket) rather than Human Access (charging per user login).

While the “SaaS-pocalypse” of early 2026 has decimated many mid-tier software companies, a clear group of “survivors” has emerged. These companies aren’t just weathering the storm; they are thriving by successfully decoupling their revenue from “human seats” and tethering it to AI outcomes.

Here are the software survivors and the strategies they used to outrun the replacement narrative.


1. The “Infrastructure Backbone”: Microsoft (MSFT)

Microsoft is the ultimate survivor because they own the “gas” that every other AI agent needs to run.

  • The Strategy: While their seat-based Office 365 revenue is vulnerable to compression, they have pivoted to Azure AI. For every customer that fires a human and hires an AI agent, Microsoft still wins through the massive compute power required to run that agent.
  • Key Stat: In FY26 Q1, Azure revenue grew 40%, significantly outpacing the market as the “World’s AI Supercomputer.”

2. The “Back-Office Orchestrator”: ServiceNow (NOW)

ServiceNow has avoided the “seat-loss” trap by focusing on operational efficiency rather than just user headcount.

  • The Strategy: Their “Now Assist” AI doesn’t just help people do work; it “self-heals” IT systems. Instead of selling 10 seats to an IT desk, they sell a platform that reduces incident resolution time by 50%.
  • The Survivor Logic: They have successfully shifted toward “Outcome-Based Pricing,” where companies pay for the value of the resolved issue, not the number of IT staff logged in.

3. The “Creative Currency” Leader: Adobe (ADBE)

After a brutal 2025, Adobe staged a massive comeback in early 2026 by reinventing how they charge for their tools.

  • The Strategy: They introduced “Generative Credits” as a new form of currency. Even if a design team shrinks, the remaining members (and their AI assistants) use exponentially more credits to generate high-resolution video and 3D assets via Firefly.
  • The Results: In Q1 2026, Adobe reported that AI-first ARR (Annual Recurring Revenue) more than tripled year-over-year.

4. The “Data Fortress”: Palantir (PLTR)

Palantir is widely considered the strongest “pure-play” survivor because they never relied on a per-seat model to begin with.

  • The Strategy: Their AIP (AI Platform) acts as a “private AI factory” for government and large enterprises. They solve the “hallucination” and “security” problems that prevent companies from using raw LLMs.
  • The Moat: Because they integrate deep into a company’s private data, the switching costs are astronomical. They are the “brains” of the enterprise, making them irreplaceable by generic AI agents.

5. The “Usage-Based” Pioneer: HubSpot (HUBS)

While still volatile, HubSpot is being labeled a survivor because they “cannibalized themselves” before the market could.

  • The Strategy: In 2025, they moved to a Usage + Seat hybrid model. They aggressively launched “AI Agents” that can work alongside humans. By making the platform the home for all customer data, they ensure that even if a sales team gets smaller, the value of the data in HubSpot gets larger.
  • Zacks Rank: As of April 2026, it holds a Rank #1 (Strong Buy) based on its resilience in moving “upmarket.”

Comparison of Survival Strategies

The “Safe Haven” Sector: Cybersecurity

Stocks like CrowdStrike (CRWD) and Palo Alto Networks (PANW) are being viewed as “structural survivors.”

The Logic: AI has made cyberattacks faster and more frequent. You cannot fight an AI-driven attack with a human-driven defense. This has created an inelastic demand for AI-native security software, protecting their business models from seat-count volatility.

Which of these “survival” tactics do you think is most sustainable for the long term: the “tax on compute” (Microsoft) or the “success-based fees” (Salesforce)?

Thomson Reuters leans on proprietary data in AI race as disruption fears mount

Published in The Globe and Mail on February 24, 2026

Thomson Reuters Corp. TRI-T  is betting on the value to professionals of artificial intelligence agents that can carry out complex tasks accurately and on their own, seeking to tamp down fears of disruption that have hung over the software sector in recent weeks.

As AI-based products flood the market, Toronto-based Thomson Reuters is seeking to draw a contrast. On one side is its own software, trained using a vast trove of content spanning the legal, tax and corporate sectors. And on the other, new plug-in tools brought to market by AI giants, which are directly challenging incumbents.

To highlight the difference, Thomson Reuters is making the case that its AI-based software is already taking hold at law firms as well as tax practices, as lawyers and accounting professionals seek to speed up their work and automate laborious tasks.

The company announced Tuesday that its AI-enabled CoCounsel technology now has one million users in more than 100 countries and territories.

Chief product officer David Wong predicts a turning point this year for businesses’ relationship with AI. He expects professional companies will focus more on the return they’re getting from AI investments.

“We are actually in a bit of an ROI crisis,” Mr. Wong told reporters. “Businesses have been experimenting with AI. They bought licences. They’ve run pilots. They’ve told their boards, ‘we’re investing in AI transformation.’ But they’re struggling to show results.”

Slumping tech stocks revive concerns about AI-fuelled disruption

Software and data providers such as Thomson Reuters have watched their share prices plunge lately, not for that reason, but in response to new tools for lawyers released by Anthropic, a leading AI company that makes the Claude large language models.

For some investors, that raised the risk that established software companies could be disrupted, and muddied the outlook about who will win or lose in the race to deploy AI for professionals.

In response, Thomson Reuters chief executive officer Steve Hasker said the market reaction “represents anxiety and not fundamentals.”

Woodbridge Co. Ltd., the Thomson family holding company and controlling shareholder of Thomson Reuters, also owns The Globe and Mail.

Although some investors interpreted Anthropic’s new tools as a direct threat to software providers, Thomson Reuters chief technology officer Joel Hron said the company has “developed a particularly deep collaboration” with Anthropic, which includes collaboration on engineering and research.

Thomson Reuters worked closely with Anthropic for the past year, using Claude as a foundation to develop the newest version of CoCounsel, which is billed as an autonomous legal assistant that can do its own research and deliver human-calibre output. A lawyer then reviews and validates what the agent drafts.

“This is not a black box,” Mr. Hron said. “It is meant to be a human collaborator.”

One Thomson Reuters tax product features an AI agent that helps prepare multiple tax returns for companies collecting sales tax in many jurisdictions, then flags items that need human review. The product’s first version cut the total amount of time spent on the process, which is typically very manual, by 60 to 70 per cent, Mr. Wong said.

Thomson Reuters has also been privately working on a project to develop a proprietary model, trained on a more concentrated set of data that draws on Thomson Reuters’s expertise in professional services. The company has worked closely with academics on the project.

Early benchmarking tests highlighted by Thomson Reuters suggest that its own model outperformed prominent rivals such as OpenAI’s GPT-5 and Anthropic’s Claude Opus 4.5 on tests of reasoning and factuality, document review, summarization and AI-assisted research.

Some products present well in demonstrations but stumble when it comes to accuracy and verification, said Prof. Jonathan Richard Schwarz, head of AI research at Thomson Reuters and a visiting professor at Imperial College London.

On “correctness” and an emphasis on evidence, “the models are really struggling,” he said. “Rather than throwing more hardware and more compute at the same sort of approach, really you should try and bring in this domain expertise into the training process.”

Thomson Reuters leans on proprietary data in AI race as disruption fears mount – The Globe and Mail

As of January 21, 2026, GoDaddy (NYSE: GDDY) is in a precarious position

Published January 21, 2026

The stock is currently in the middle of a severe correction, trading near 52-week lows despite posting what looked like solid financial numbers in Q3 2025.

GDDY

Here is a a 3-year weekly chart showing the major downtrend:

GoDaddy 3-year weekly chart

Here is a screenshot of my spreadsheet for GoDaddy:

GoDaddy financials

_____________

Here is the “Executive Summary” of the situation: Wall Street is punishing the stock because it views GoDaddy as a “Legacy” tech company falling behind in the AI race, even though its current cash flow remains strong.

1. Stock Performance Snapshot (Jan 2026)

The stock chart is ugly right now. GoDaddy has been one of the poorer performers in the tech sector to start 2026.

  • Current Price: ~$104.00 – $105.00 USD
  • Trend: Aggressive Downtrend. The stock is down roughly 14–16% year-to-date (Jan 1–21) and has nearly cut in half from its 2025 highs of ~$216.
  • Market Cap: ~$14.8 Billion
  • 52-Week Range: $104.03 (Low) – $216.00 (High)
  • Recent Catalyst: In the first two weeks of January, multiple analysts (Morgan Stanley, Jefferies, Cantor Fitzgerald) cut their price targets, citing concerns that GoDaddy’s “Airo” AI product isn’t generating revenue fast enough to offset slowing domain growth.

2. Financial Health (The “Disconnect”)

This is the confusing part for many investors. If you look only at the income statement, the company looks fine. The sell-off is driven by sentiment and future growth fears, not current bankruptcy risk.

  • Revenue (Q3 2025):$1.32 Billion (+10% Year-over-Year).
    • Status: Growing, but “boring” single-digit to low-double-digit growth.
  • Profitability (EPS): $1.51 per share (Beat expectations of $1.48).
  • Free Cash Flow:$440.5 Million (+21% YoY).
    • Critical Stat: GoDaddy is a cash-generating machine. They are generating over $1.2 Billion in free cash flow annually.
  • Valuation:
    • P/E Ratio: ~15x – 18x (This is considered “cheap” for tech, suggesting it is trading like a utility company rather than a growth stock).

3. The “Bear Case” (Why is it crashing?)

Investors are fleeing the stock for three specific reasons in 2026:

  1. The “AI Loser” Narrative: The market fears that Generative AI (like ChatGPT or heavily funded startups) will make it too easy for people to build websites without GoDaddy. GoDaddy launched its own AI tool (GoDaddy Airo) to fight this, but early 2026 data suggests adoption hasn’t been the “game changer” investors wanted.
  2. Insider Selling: In early January 2026, key executives (including the Chief Strategy Officer) sold shares. While often routine, doing so during a stock slide spooked retail investors.
  3. Domain Saturation: The “Core Platform” (selling domain names) is a mature, low-growth business. Investors are looking for 20%+ growth, and GoDaddy is giving them 7–8%.

4. Upcoming Catalyst: Q4 Earnings

  • Estimated Date: Late February 2026 (Likely around Feb 13–15).
  • What to Watch:
    • Guidance for 2026: This is the only thing that matters. If they guide for revenue growth below 6%, the stock could break under $100.
    • Share Buybacks: Because the stock is so “cheap” (low P/E), management has been aggressively buying back their own stock. Watch to see if they announce a new, massive buyback authorization to defend the stock price.

Summary Strategy

  • The Bull View: You are buying a cash-cow monopoly at a discount (~$104). The fear is overblown, and their cash flow will fund massive buybacks that force the stock up eventually.
  • The Bear View: This is a “Value Trap.” It looks cheap, but revenue growth is permanently slowing because AI is making their core business model (selling website templates) obsolete.

As of January 21, 2026, the competitive landscape has thinned out significantly. The most important update for your comparison is that Squarespace is gone from the public markets, leaving GoDaddy and Wix as the last two major standalone “Website Builder” stocks.

Here is how GoDaddy stacks up against its primary rival (Wix) and the premium e-commerce giant (Shopify) in this current market correction.

1. The “Missing” Competitor: Squarespace (SQSP)

  • Status: Private / Delisted.
  • What happened: Squarespace was acquired by the private equity firm Permira in late 2024 for roughly $7.2 billion.
  • Implication: You can no longer buy Squarespace stock. This actually helps GoDaddy’s “scarcity value”—if an investor wants exposure to the “Do-It-Yourself Website” sector, they essentially have to choose between GoDaddy and Wix.

2. Head-to-Head: GoDaddy (GDDY) vs. Wix (WIX)

This is the main battle. Both stocks are currently down, but for different reasons.

FeatureGoDaddy (GDDY)Wix.com (WIX)
Stock Price~$104 USD~$76 – $80 USD
Valuation (P/E)~15x – 16x (Value Stock)~30x – 34x (Growth Stock)
The “Vibe”“The Cash Cow”“The Fallen Star”
Why it’s downFear of AI obsolescence; slow growth.Valuation compression; losing premium status.
Cash FlowMassive (~$1.2B/year).Growing, but less stable than GDDY.

The Analysis:

  • GoDaddy is the “Safe” Play: It trades at half the valuation of Wix (15x vs 30x). Wall Street treats it like a utility company—boring, reliable cash flow, low growth.
  • Wix is the “High Beta” Play: Wix is trading at a much higher premium because it historically grew faster. However, its stock has crashed harder recently (down significantly from its 52-week highs of ~$230) as investors question if it deserves that premium in an AI world.

3. The “Premium” Alternative: Shopify (SHOP)

While not a direct competitor for “simple” websites, Shopify is often grouped in the same basket.

  • Price: ~$167 USD
  • Status: The clear leader. While GoDaddy and Wix fight for the “small local business” market (Pizza shops, Plumbers), Shopify owns the “Online Retail” market.
  • Valuation: Extremely expensive compared to GDDY. You pay a massive premium for Shopify because its growth is structurally higher.

Summary Comparison Table (Jan 2026)

CompanyStatusValuation RiskPrimary Investor Fear
GoDaddyPublicLow (Cheap at 15x P/E)“Will AI replace domain names?”
WixPublicHigh (Expensive at 30x P/E)“Can they justify this premium?”
SquarespacePrivateN/ATaken private to fix issues away from public eye.
ShopifyPublicMedium (Priced for perfection)“Consumer spending recession.”

Strategic Conclusion

  • If you want “Value”: GoDaddy is arguably the safest bet. Even if it doesn’t grow fast, the massive share buybacks (funded by that $1.2B cash flow) put a “floor” under the stock price around $95–$100.
  • If you want “Rebound Potential”: Wix has fallen so far that a simple earnings beat could send it up 20% in a day. It is the riskier, higher-reward trade.

As of January 2026, the short interest data for GoDaddy (GDDY) tells a very specific story: This is NOT a “hated” stock.

Despite the ugly stock chart, hedge funds are not aggressively betting on GoDaddy’s collapse. The selling pressure you are seeing is likely coming from “Long Only” funds selling their shares (profit-taking or rotation), rather than short sellers piling in.

Here is the breakdown of the data found for mid-January 2026.

1. The “Headline” Number

  • Short Interest (% of Float): ~4.2%
  • The Verdict:Low / Normal.
    • Context: A “Crowded Short” (like GameStop in 2021 or a failing bank) typically has short interest above 20%.
    • Peer Comparison: GoDaddy is actually shorted less than its peer group average (which hovers around ~8–9%). This means Wall Street sees GoDaddy as safer than many other mid-cap tech stocks.

2. The “Squeeze” Indicator (Days to Cover)

  • Days to Cover: ~4.1 to 4.5 Days
  • What this means: If all the short sellers decided to cover (buy back) their shares at once, it would take them roughly 4.5 days of normal trading volume to do it.
  • Analysis: This is moderately elevated.
    • Usually, anything over 5 days is considered “Squeeze Territory.”
    • While not extreme, a 4.5 ratio means that if GoDaddy releases a surprise positive earnings report in February, the stock could “pop” 10–15% very quickly because those short sellers would scramble to get out.

3. Institutional Ownership (The “Smart Money”)

  • Ownership: >90% (Very High).
  • The Player: The biggest holders are the “Big Three” (Vanguard, BlackRock, State Street).
  • The Signal: When institutional ownership is this high, it confirms that the stock is widely held in pension funds and ETFs. The recent price drop is likely due to ETF rebalancing or sector rotation (funds selling “Tech” to buy “Energy” or “Defense”), rather than a loss of faith in the company itself.

Summary Table

MetricCurrent LevelSentiment
Short % of Float4.2%Neutral/Safe (Not a target).
Days to Cover4.5Moderate (Minor squeeze potential).
TrendDecliningShorts are actually closing positions, not adding new ones.

Strategic Takeaway

Since the Short Interest is low (4%), you cannot rely on a “Short Squeeze” to save the stock. It has to rise on fundamental merit (Earnings).

  • Bull Case: The sellers are exhausted. With shorts not adding pressure, any good news will lift the stock easily.
  • Bear Case: There is no “guaranteed buyer” (short cover) waiting in the wings. If earnings are bad, the stock will drift lower naturally.

The date you need to circle on your calendar is Thursday, February 12, 2026.

While GoDaddy has not yet issued the official press release confirming the exact minute, historical patterns and analyst consensus point to this date.

The Event Details

  • Date: Thursday, Feb 12, 2026 (Estimated)
  • Time: After Market Close (approx. 4:05 PM ET)
  • The Report: Q4 2025 Earnings & Full Year 2026 Guidance

Why this specific date matters

This is the “Show Me” quarter. The stock has drifted down for three weeks because investors are nervous about the 2026 outlook. This report will resolve that anxiety one way or the other.

The “Pass/Fail” Metrics: The algorithms will react instantly to three specific numbers. You can write these down to grade the report yourself when it drops:

  1. Revenue Growth: Wall Street expects ~$1.27 Billion.
    • The Danger Zone: If they miss this number, it confirms the “AI is killing their business” narrative.
  2. Profit (EPS): Consensus is $1.58 per share.
    • The Bull Signal: GoDaddy has beaten earnings estimates in 3 of the last 4 quarters. If they post something like $1.65+, it proves their cost-cutting is working better than expected.
  3. The “Wild Card”: Buyback Authorization
    • With the stock near 52-week lows, watch for a sentence in the press release saying: “Board authorizes a new $1 Billion share repurchase program.” That single line would likely send the stock up 10% immediately.

Recommendation: Do not buy “Call Options” for this event unless you are willing to lose 100% of the premium. The “Implied Volatility” will be expensive. If you like the stock, the safer play is to simply hold the shares or sell “Put Options” at the $95 strike to buy it cheaper if it crashes.

GoDaddy Inc. – Investors for the latest financials.

_____________

Technical Analysis is about trading with the trend

Note: This technical analysis is for educational purposes. Please conduct your own analysis or consult a financial advisor before making investment decisions. The author of this article may hold long or short positions in the featured stocks or indexes. The article was written with the help of AI and was reviewed by an editor.

© 2026 TradeOnline.ca InvestOnline.ca ChartAnalysis.ca

As of January 14, 2026, Kraken Robotics (TSX-V: PNG) is in the middle of a massive breakout moment.

Published January 14, 2026

For years, Kraken was known as a “niche sonar company.” In early 2026, it is rapidly re-rating as a critical defense supplier for autonomous underwater warfare.

Here is a 3-year chart:

Kraken Robotics 3-year chart

Here is the overview of the company’s current status, financials, and the major news from this week that is driving the stock.

1. The “Headline” News (January 2026)

The most important update for you is the announcement made just yesterday (Jan 13, 2026).

  • The Deal: Kraken secured $35 million in purchase orders for its SeaPower™ batteries.
  • Why it matters: This confirms that Kraken is no longer just selling “eyes” (Sonar) for underwater drones; it is now selling the “heart” (Power).
  • The Customer: While unnamed, industry analysts strongly link these batteries to major defense prime contractors (like Anduril and its “Ghost Shark” program) who need massive, pressure-tolerant batteries for long-endurance missions.

2. Financial Snapshot (The Growth Curve)

Kraken has shifted from “unprofitable R&D” to “profitable growth.”

  • Stock Price: Trading in the $5.25 – $6.10 CAD range (up significantly from the $1.00 range seen in 2024).
  • Market Cap: Now exceeding $1.1 Billion CAD, moving it out of “micro-cap” territory.
  • Revenue Run Rate:
    • Q3 2025 (Last reported): Revenue hit $31.3 million (up 60% year-over-year).
    • EBITDA: Adjusted EBITDA hit $8.0 million (up 92%).
    • 2026 Outlook: Analysts expect 2026 revenue to easily clear $150M+ as their new factory comes online.

3. The “Three-Pillar” Business Model

Kraken is unique because it owns the entire technology stack for subsea warfare and energy.

A. The “Eyes”: Synthetic Aperture Sonar (SAS)

  • Product: KATFISH™ Towed SAS System.
  • The Tech: Traditional sonar creates blurry images. Kraken’s SAS creates “photo-quality” images of the seabed using software processing.
  • Use Case: Minehunting (finding sea mines) and Pipeline Inspection.
  • Key Clients: NATO navies (Canada, USA, Denmark, Poland).

B. The “Heart”: SeaPower™ Batteries (The New Growth Engine)

  • The Tech: Most subsea batteries need heavy steel pressure vessels to survive deep water. Kraken’s batteries are pressure-tolerant (potted in polymer). They don’t need a heavy shell, so they are lighter and hold 2x the energy of competitors.
  • Catalyst: A new Battery Manufacturing Facility in Nova Scotia is opening this quarter (Q1 2026) to triple their production capacity.

C. The “Service”: Robotics as a Service (RaaS)

  • Instead of selling the robot ($2M), Kraken will bring their robot and crew to your site and charge you per day to map the ocean floor.
  • Acquisition: In 2025, they acquired 3D at Depth, adding “Subsea LiDAR” (lasers) to their service offering, allowing them to measure underwater infrastructure with millimeter accuracy for oil & gas clients.

4. Investment Risks

Despite the hype, there are two specific risks to watch in 2026:

  • Valuation: The stock is trading at a high multiple (Price-to-Sales > 10x). The market has “priced in” perfection for the new battery factory. Any delay in opening that factory could hurt the stock.
  • Geopolitics: Their growth is tied to Defense budgets. If the Ukraine/Russia or China/Taiwan tensions de-escalate significantly, the “urgency” for underwater drones may fade.

Summary

Kraken Robotics has successfully graduated from a “science project” to a Defense Industrial mid-cap.

  • 2024 Story: “They have cool sonar.”
  • 2026 Story: “They are the primary battery supplier for the Western world’s underwater drone fleet.”

As of January 2026, the landscape for “Inverse ETFs” in Canada has changed significantly due to the massive rebranding of Horizons ETFs to Global X

Published January 13, 2026

If you are looking for the famous “H-Series” tickers (like HXD, HIX, or HQD), many of them have been renamed and given new ticker symbols.

Here are the most popular Inverse Canadian ETFs, organized by sector and updated with their new 2026 tickers.

1. Betting Against the Canadian Market (TSX 60)

These are the standard tools for shorting the broad Canadian economy (Banks, Energy, Rail).

StrategyNew TickerOld TickerFund Name
-1x InverseCNDI(HIX)BetaPro S&P/TSX 60 Daily Inverse ETF
-2x BearCNDD(HXD)BetaPro S&P/TSX 60 -2x Daily Bear ETF
  • Use Case: You believe the general Canadian economy is entering a recession.
  • Note: CNDD provides double leverage (if TSX falls 1%, CNDD rises 2%).

2. Betting Against Canadian Energy

You have two distinct options here: betting against the Oil Companies (Stocks) or betting against the Price of Oil (Commodity).

StrategyNew TickerOld TickerFund Name
Short Oil STOCKSNRGD(HED)BetaPro S&P/TSX Capped Energy -2x Daily Bear
Short Oil PRICEHOD(Kept Ticker)BetaPro Crude Oil Inverse Leveraged Daily Bear
Short Nat GasHND(Kept Ticker)BetaPro Natural Gas Inverse Leveraged Daily Bear
  • Crucial Distinction:
    • Buy NRGD if you think Suncor/CNQ stocks will fall.
    • Buy HOD if you think the WTI Oil Price will fall. (HOD is extremely volatile and suffers from “decay” if held long-term).

3. Betting Against Canadian Banks

With the mortgage renewal cliff in 2026, this is a popular trade for those bearish on the housing market.

StrategyNew TickerOld TickerFund Name
-2x Bank BearCFOD(HFD)BetaPro S&P/TSX Capped Financials -2x Daily Bear

4. Betting Against US Tech (TSX Listed)

Many Canadians use their CAD accounts to short the US market without converting currency.

StrategyNew TickerOld TickerFund Name
Short S&P 500SPXD(HSD)BetaPro S&P 500 -2x Daily Bear ETF
Short NASDAQQQD(HQD)BetaPro NASDAQ-100 -2x Daily Bear ETF

⚠️ Critical Warning: The “Daily Reset” Trap

These ETFs are not long-term investments.1 They are designed for 1-day trades.

  • The Decay: Because they reset their leverage every single day, holding them for weeks or months will erode your value, even if the market goes in your direction.2
  • Example: If the market is flat but volatile (up 2% one day, down 2% the next), you will lose money in both the Bull (+2x) and Bear (-2x) funds over time.
  • Rule of Thumb: Do not hold these tickers (especially the -2x ones like CNDD or HOD) for longer than a few days unless you are actively managing the position.

Yes, CNDI (BetaPro S&P/TSX 60 Daily Inverse ETF) does decay.

Even though it is only -1x (Single Inverse) and not -2x like the riskier funds, it still suffers from “Volatility Drag” because of its daily reset mechanism.

If you hold CNDI for more than one day in a choppy market, you are mathematically guaranteed to lose value over time, even if the TSX 60 ends up flat.

The Math: How the “Daily Reset” Eats Your Money

To understand why it decays, look at this simple 2-day scenario where the market goes Up one day and Down the next, ending back where it started.

Scenario: The “Choppy” Market

Imagine the TSX 60 Index starts at $100.

  • Day 1: The Market goes UP 10%.
  • Day 2: The Market goes DOWN 9.09% (this brings it exactly back to $100).

Here is what happens to your CNDI shares:

DayMarket ActionCNDI Action (Inverse)Your CNDI Value
StartIndex at $100Buy at $100$100.00
Day 1Market +10% (to $110)CNDI -10%$90.00
Day 2Market -9.09% (back to $100)CNDI +9.09%$98.18
ResultMarket is FLAT ($0 change)You LOST ~$1.82-1.8% Loss

The Decay: The market did nothing (returned to zero), but you lost nearly 2% of your money. This is because losing 10% hurts you more than gaining 9% helps you. You are trying to recover from a smaller base ($90 instead of $100).

Why CNDI Decays Slower than CNDD (-2x)

While CNDI decays, it is much safer than the -2x leveraged version (CNDD). Decay essentially “squares” with leverage.

  • CNDI (-1x): Moderate Decay (Dangerous over months).
  • CNDD (-2x): Rapid Decay (Dangerous over weeks).

Summary Rule

  • Use CNDI for: A trade lasting 1 day to 2 weeks when you are confident the market will drop in a straight line.
  • Do NOT use CNDI for: A long-term “hedge” against a recession. If the market grinds sideways for 6 months before crashing, your CNDI shares will have already decayed significantly, and you won’t get the full protection you expected.

Better Hedge: If you need protection for 6+ months, it is often cheaper to buy Put Options on the TSX 60 (XIU) rather than holding an inverse ETF that bleeds value daily.

_____________

Technical Analysis is about trading with the trend

Note: This technical analysis is for educational purposes. Please conduct your own analysis or consult a financial advisor before making investment decisions. The author of this article may hold long or short positions in the featured stocks or indexes. The article was written with the help of AI and was reviewed by an editor.

© 2026 TradeOnline.ca InvestOnline.ca ChartAnalysis.ca

Contact[email protected]

RBC (RY.TO) reported net income of $5.4-billion for the three-month period from May through July, up 21 per cent from the same time in 2024.

Published August 27, 2025

Adjusted earnings per share were $3.84, well above the average analyst expectation of $3.29 per share, according to S&P Capital IQ.

Here is a 4-year candlestick chart:

Royal Bank 4-year weekly chart

Royal Bank of Canada (RBC) is a Canadian multinational financial services company and the largest bank in Canada by market capitalization. Founded in 1864, it operates globally and is a publicly traded company on the Toronto, New York, and SIX Swiss exchanges under the symbol RY.

Business Segments and Services

RBC is a diversified financial institution with five main business segments:

  • Personal and Commercial Banking: This is its largest segment, offering a wide array of financial products and services to individuals and businesses in Canada, the U.S., and the Caribbean. This includes credit cards, mortgages, loans, and everyday banking.
  • Wealth Management: Providing investment and wealth management solutions to clients worldwide. This segment includes its brokerage firm, RBC Dominion Securities, and RBC Global Asset Management.
  • Capital Markets: This is the investment banking arm, providing corporate and investment banking services, including mergers and acquisitions, debt and equity financing, and global markets solutions to corporations and institutional investors.
  • Insurance: Offering a range of life, health, home, auto, travel, and wealth insurance products for individuals and groups.
  • Investor and Treasury Services: Providing asset services, cash management, and treasury services to institutional clients.

Recent Financial Performance

In the third quarter of 2025, RBC reported a record net income of $5.4 billion, a significant increase from the previous year. This growth was driven by strong performance across all business segments, particularly in Capital Markets and Personal Banking. The bank also increased its quarterly dividend and maintained a robust capital position.

  • Net Income (Q3 2025): $5.4 billion
  • Revenue (Q3 2025): $16.99 billion
  • Earnings per Share (Diluted): $3.75
  • Return on Equity (ROE): 17.3%
  • Common Equity Tier 1 (CET1) Ratio: 13.2% (well above regulatory minimums)

Key Facts and Figures

  • Headquarters: Toronto, Ontario, Canada (corporate) and Montreal, Quebec, Canada (head office)
  • Employees: Over 100,000 worldwide
  • Global Presence: Serves more than 20 million clients in 29 countries
  • Assets: Holds over $2.0 trillion in assets
  • Stock Symbol: RY on the TSX and NYSE
  • 52-Week High: $191.22 CAD (as of August 22, 2025)
  • 52-Week Low: $151.25 CAD

https://www.rbc.com/investor-relations

_____________

Technical Analysis is about trading with the trend

Note: This technical analysis is for educational purposes. Please conduct your own analysis or consult a financial advisor before making investment decisions. The author of this article may hold long or short positions in the featured stocks or indexes.

© 2025 TradeOnline.ca InvestOnline.ca ChartAnalysis.ca

Contact[email protected]

BCE breakout on the daily candlestick chart

Published July 13, 2025

BCE daily candlestick chart

But proceed with caution. Here is the 4-year weekly chart showing the major downtrend:

BCE 4-year weekly chart

https://www.bce.ca/investors/overview

_____________

Technical Analysis is about trading with the trend

Note: This technical analysis is for educational purposes. Please conduct your own analysis or consult a financial advisor before making investment decisions. The author of this article may hold long or short positions in the featured stocks or indexes.

© 2025 TradeOnline.ca

Contact[email protected]

Zoominfo (GTM) chart in long-term downtrend

Published June 3, 2025

This is an example of a a major downtrend on the 4-year weekly chart. The 200-day simple moving average defines the downtrend.

Zoominfo chart showing the major downtrend.

https://ir.zoominfo.com

_____________

Technical Analysis is about trading with the trend

Note: This technical analysis is for educational purposes. Please conduct your own analysis or consult a financial advisor before making investment decisions. The author of this article may hold long or short positions in the featured stocks or indexes.

© 2025 TradeOnline.ca

Contact: [email protected]

Groupon (GRPN) chart indicates price is moving higher

Published May 27, 2025

It is a transformation story and is undervalued on a market capitalization/sales ratio. Enjoy the ugly ducking as it transforms into a swan. The easy money has been made from the 2023 low but the intermediate uptrend trend is still in effect.

Here is a 4-year weekly chart. The 50-day crossing above the 200-day are simple entry points. The 50-day moving below the 200-day are sell points. You will get a little churn but you will always be on the right side of the trade with some lag.

Groupon (GRPN) stock with an intermediate uptrend

https://investor.groupon.com/home/default.aspx

_____________

Technical Analysis is about trading with the trend

Note: This technical analysis is for educational purposes. Please conduct your own analysis or consult a financial advisor before making investment decisions. The author of this article may hold long or short positions in the featured stocks or indexes.

© 2025 TradeOnline.ca

Contact: [email protected]

Microsoft (MSFT) testing the all-time high on the weekly chart

Published May 25, 2025

There will be resistance and some profit taking at this point

Microsoft 4-year weekly chart showing the movement above the 200-day moving average and testing the all-time high

_____________

Technical Analysis is about trading with the trend

Note: This technical analysis is for educational purposes. Please conduct your own analysis or consult a financial advisor before making investment decisions. The author of this article may hold long or short positions in the featured stocks or indexes.

© 2025 TradeOnline.ca

Contact: [email protected]