Tag Archives: silver

Silver is seeing a significant sell-off the morning of March 3, 2026

Published March 3, 2026

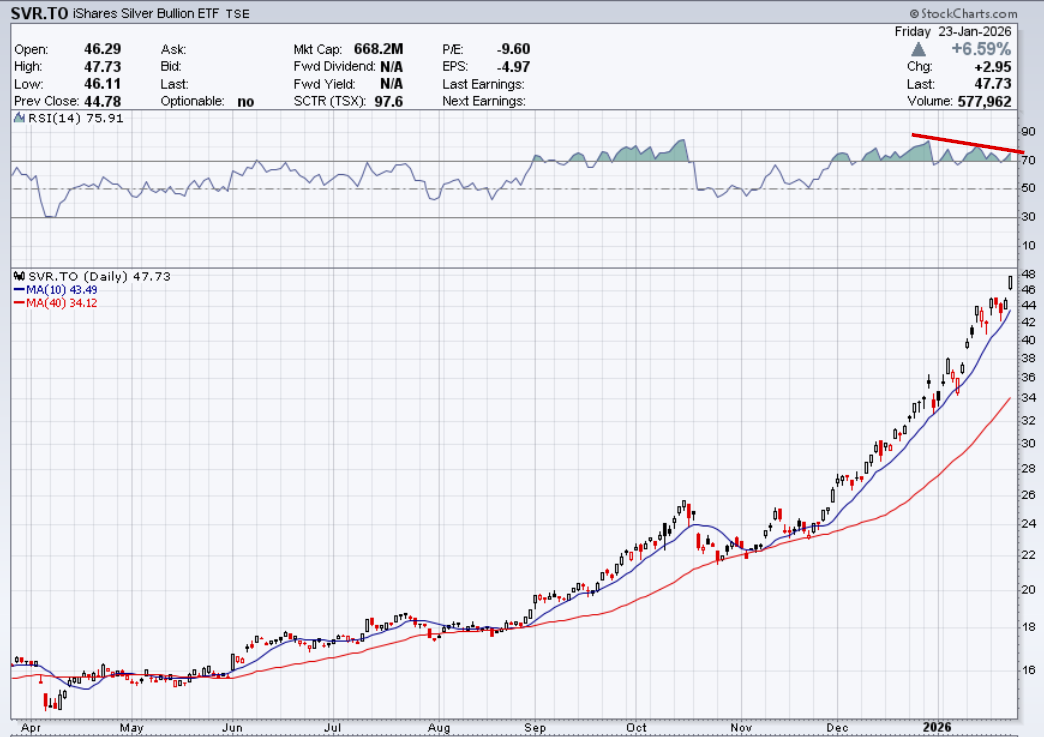
Here is a 6-month silver chart:

Silver six month chart

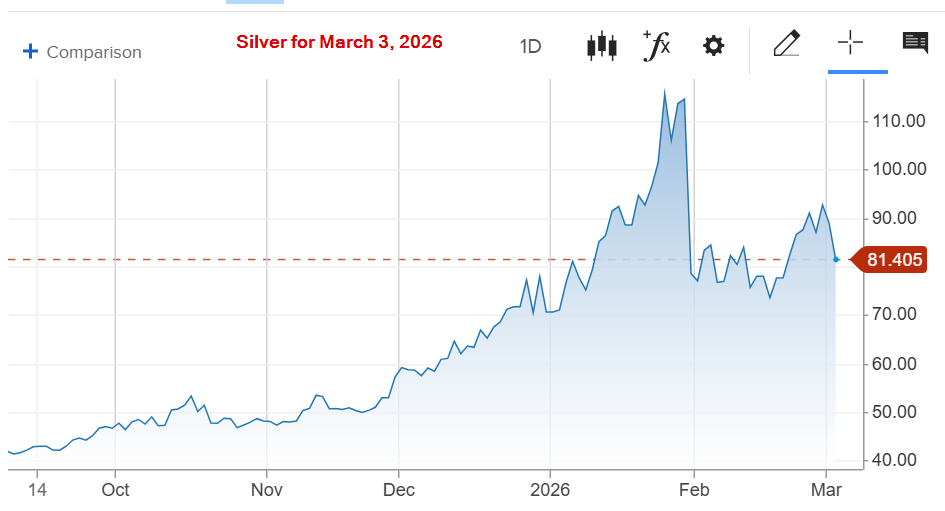
Silver is seeing a significant sell-off this morning, Tuesday, March 3, 2026, primarily because the initial “geopolitical shock” that drove prices to record highs over the weekend is beginning to fade, leading to aggressive profit-taking.

While gold is holding up better as a pure safe-haven, silver (the “restless cousin”) is down sharply—dropping as much as 7-8% in early trading to move back toward the $82–$84/oz range.

Here are the three specific factors driving the move:

1. The “Safe-Haven” Rotation to the US Dollar

While silver often benefits from geopolitical tension (like the current conflict involving the US, Israel, and Iran), the US Dollar Index (DXY) has surged to a 5-week high (near 98.5). In times of extreme uncertainty, global capital often flows into the dollar and US Treasuries rather than metals. Since silver is priced in dollars, a stronger greenback makes it more expensive for international buyers, creating immediate downward pressure.

2. Shifting Fed Expectations (The “September” Delay)

Stronger-than-expected US manufacturing and inflation data (ISM Prices Paid hitting a 3.5-year high) have changed the math for interest rates.

  • The News: Markets have pushed back the expected timing for the next Federal Reserve rate cut from July to September 2026.
  • The Impact: Silver provides no yield (interest). When interest rates are expected to stay “higher for longer,” the opportunity cost of holding silver increases, causing traders to dump positions in favor of bonds.

3. Technical Profit-Taking & “Stop-Hunting”

Silver had an “explosive surge” reaching near $95–$96/oz on Sunday/Monday.

  • Overbought: The Relative Strength Index (RSI) hit extreme levels (above 70), signaling the market was overextended.
  • The Cascade: Once silver failed to hold the $95 “make-or-break” resistance level this morning, it triggered a wave of “stop-loss” orders, accelerating the slide as short-term momentum traders exited their positions simultaneously.

Summary Table: Silver’s Morning Slide

MetricStatus (Mar 3, 2026)
Current Spot Price~$84.20/oz
Daily Change-7.2% to -8.5%
Key Support$82.00 / $81.50
Main CatalystStrengthening USD + Delayed Fed Rate Cuts

_____________

Technical Analysis is about trading with the trend

Note: This technical analysis is for educational purposes. Please conduct your own analysis or consult a financial advisor before making investment decisions. The author of this article may hold long or short positions in the featured stocks or indexes. The article was written with the help of AI and was reviewed by an editor.

© 2026 TradeOnline.ca InvestOnline.ca ChartAnalysis.ca

Bearish Divergence flashing on the SVR (and general silver) charts as of late January 2026

Published January 25, 2026

Silver (SVR.TO) daily chart showing divergence with the RSI momentum indicator.

While the price of SVR has hit record highs (around $47.73), the underlying momentum indicators are telling a different story. This is a classic technical “red flag” that often precedes a price correction.

1. RSI Bearish Divergence (The Momentum Gap)

The most prominent divergence is between the Price and the Relative Strength Index (RSI):

  • The Price: SVR has made “Higher Highs” throughout January, climbing from $33 to over $47.
  • The RSI: The RSI momentum indicator peaked in mid-January (reaching an extreme overbought level above 85) and has since been making “Lower Highs.”
  • What this means: Even though the price is still going up, the strength of the buying pressure is weakening. It’s like a car still rolling uphill but with its engine losing power.

2. Premium Divergence (The “Retail Fever”)

There is also a divergence between the ETF Price and the Physical Silver Value:

  • As we noted, SVR is trading at a 3.67% premium to its Net Asset Value (NAV).3
  • Normally, this premium stays near 0%. When it “diverges” and stays high while silver hits $100, it indicates that retail panic-buying is driving the ticker more than the actual value of the silver bars in the vault.
  • The Danger: If the rally pauses, this premium often evaporates instantly, causing the ETF to drop significantly faster than the spot price of silver.

Summary of Technical Signals (Jan 25, 2026)

IndicatorSignalInterpretation
Price ActionBullishSVR is comfortably above its 50-day ($30.76) and 200-day ($21.56) averages.
RSI (14-day)Bearish DivergencePrice is making new highs; RSI is making lower highs (currently ~73).
Premium/NAVBearish+3.67% premium is historically unsustainable and suggests “froth.”
CandlesticksCautionRecent “long-wick” candles near $48 suggest sellers are starting to overpower buyers at these levels.

Technical Strategy

In 2026, many traders are using the $44.00 level as their “line in the sand.”

  • If SVR stays above $44.00, the “parabolic” trend is still alive.
  • If it closes below $44.00 on high volume, the bearish divergence is officially “confirmed,” and the first target for a correction would likely be the 20-day moving average, currently near $38.00.

_____________

Technical Analysis is about trading with the trend

Note: This technical analysis is for educational purposes. Please conduct your own analysis or consult a financial advisor before making investment decisions. The author of this article may hold long or short positions in the featured stocks or indexes. The article was written with the help of AI and was reviewed by an editor.

© 2026 TradeOnline.ca InvestOnline.ca ChartAnalysis.ca

Silver at another all-time high

Published December 28, 2025

Analysis: Trade with the trend until it ends. Enjoy the ride.

Silver at another all-time high of 77.196

_____________

Technical Analysis is about trading with the trend

Note: This technical analysis is for educational purposes. Please conduct your own analysis or consult a financial advisor before making investment decisions. The author of this article may hold long or short positions in the featured stocks or indexes.

© 2025 TradeOnline.ca InvestOnline.ca ChartAnalysis.ca

Contact[email protected]

Silver in major uptrend at an all-time high

Published September 29, 2025

silver long-term chart

_____________

Technical Analysis is about trading with the trend

Note: This technical analysis is for educational purposes. Please conduct your own analysis or consult a financial advisor before making investment decisions. The author of this article may hold long or short positions in the featured stocks or indexes.

© 2025 TradeOnline.ca InvestOnline.ca ChartAnalysis.ca

Contact[email protected]

Major uptrend for silver and close to the all-time high in 2011

Published June 5, 2025

We will test the 2011 high. Enjoy the ride.

Sliver long-term chart 2006 to 2025

The Enduring Dance of Gold and Silver: A Tale of Two Precious Metals

Gold and silver, often dubbed “precious metals,” have captivated humanity for millennia, serving as currencies, symbols of wealth, and industrial essentials. While both hold inherent value and are sought after by investors, their relationship is a dynamic and often intriguing one, marked by both parallel movements and distinct divergences.

Historically, silver’s abundance meant it frequently served as a transactional currency, the “money of the common man,” while gold, rarer and more difficult to acquire, was the preserve of empires and elite wealth. This historical division of labour continues to subtly influence their modern relationship.

Similarities in Motion:

At a fundamental level, both gold and silver are considered safe-haven assets. In times of economic uncertainty, geopolitical instability, or inflationary pressures, investors often flock to both metals as stores of value, leading to their prices often moving in tandem. They are both tangible assets, outside the direct control of governments or central banks, offering a hedge against currency depreciation. Mining costs, geopolitical events impacting supply, and shifts in global demand for precious metals can also influence both markets in similar ways.

Distinctive Drivers and Divergent Paths:

Despite their shared characteristics, key differences often lead to their prices diverging:

  • Industrial Demand: This is perhaps the most significant differentiator. While gold’s industrial applications are relatively niche (primarily electronics and dentistry), silver is an indispensable industrial metal. Its superior conductivity, malleability, and reflectivity make it crucial in solar panels, electronics (from smartphones to electric vehicles), medical devices, and photography. This industrial demand makes silver more sensitive to economic cycles; when the global economy is booming, industrial demand for silver typically rises, often outpacing gold’s gains. Conversely, an economic slowdown can hit silver harder.
  • Monetary vs. Industrial Role: Gold is overwhelmingly viewed as a monetary metal, its value tied to its historical role as currency and a hedge against systemic risk. Silver, while also a precious metal, is often seen as having a dual identity: part monetary asset, part industrial commodity. This dual nature can make silver more volatile than gold.
  • Supply Dynamics: Silver is typically mined as a byproduct of other metals (like copper, lead, and zinc), meaning its supply is less responsive to its own price movements compared to gold, which is primarily mined for its own sake.
  • Price Volatility and “Poor Man’s Gold”: Due to its lower price point and higher industrial correlation, silver tends to be more volatile than gold. It often experiences larger percentage gains during bull markets for precious metals, earning it the nickname “poor man’s gold” as a more accessible entry point for investors. However, this also means it can suffer larger percentage losses during downturns.
  • The Gold/Silver Ratio: A popular metric among investors is the gold/silver ratio, which indicates how many ounces of silver it takes to buy one ounce of gold. This ratio fluctuates, and traders often use it to gauge which metal might be undervalued relative to the other, making investment decisions based on historical averages or trends in the ratio.

In conclusion, the relationship between gold and silver is one of complex interdependence. While they often move in the same general direction due to their safe-haven status, silver’s significant industrial utility introduces an additional layer of economic sensitivity, making it a more volatile and perhaps more dynamic play. Understanding these nuances is key to appreciating the enduring dance of these two valuable metals in the global economy.

Published with the help of AI and reviewed by an editor.

_____________

Technical Analysis is about trading with the trend

Note: This technical analysis is for educational purposes. Please conduct your own analysis or consult a financial advisor before making investment decisions. The author of this article may hold long or short positions in the featured stocks or indexes.

© 2025 TradeOnline.ca

Contact[email protected]