Published January 25, 2026
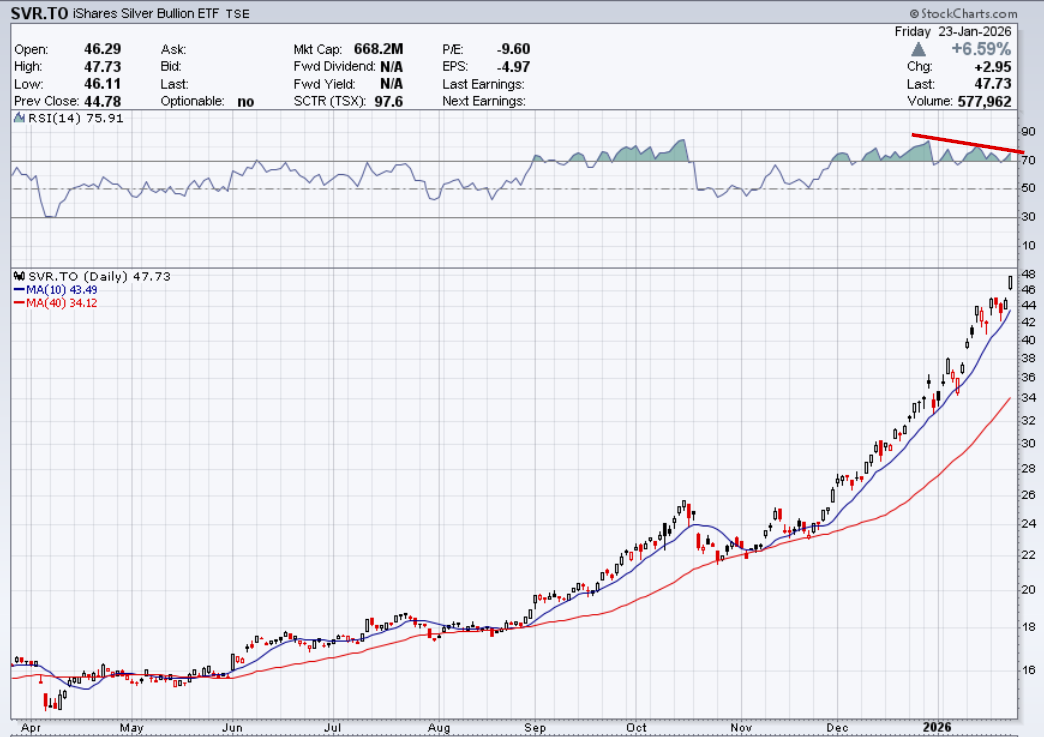
While the price of SVR has hit record highs (around $47.73), the underlying momentum indicators are telling a different story. This is a classic technical “red flag” that often precedes a price correction.
1. RSI Bearish Divergence (The Momentum Gap)
The most prominent divergence is between the Price and the Relative Strength Index (RSI):
- The Price: SVR has made “Higher Highs” throughout January, climbing from $33 to over $47.
- The RSI: The RSI momentum indicator peaked in mid-January (reaching an extreme overbought level above 85) and has since been making “Lower Highs.”
- What this means: Even though the price is still going up, the strength of the buying pressure is weakening. It’s like a car still rolling uphill but with its engine losing power.
2. Premium Divergence (The “Retail Fever”)
There is also a divergence between the ETF Price and the Physical Silver Value:
- As we noted, SVR is trading at a 3.67% premium to its Net Asset Value (NAV).3
- Normally, this premium stays near 0%. When it “diverges” and stays high while silver hits $100, it indicates that retail panic-buying is driving the ticker more than the actual value of the silver bars in the vault.
- The Danger: If the rally pauses, this premium often evaporates instantly, causing the ETF to drop significantly faster than the spot price of silver.
Summary of Technical Signals (Jan 25, 2026)
| Indicator | Signal | Interpretation |
| Price Action | Bullish | SVR is comfortably above its 50-day ($30.76) and 200-day ($21.56) averages. |
| RSI (14-day) | Bearish Divergence | Price is making new highs; RSI is making lower highs (currently ~73). |
| Premium/NAV | Bearish | +3.67% premium is historically unsustainable and suggests “froth.” |
| Candlesticks | Caution | Recent “long-wick” candles near $48 suggest sellers are starting to overpower buyers at these levels. |
Technical Strategy
In 2026, many traders are using the $44.00 level as their “line in the sand.”
- If SVR stays above $44.00, the “parabolic” trend is still alive.
- If it closes below $44.00 on high volume, the bearish divergence is officially “confirmed,” and the first target for a correction would likely be the 20-day moving average, currently near $38.00.
_____________
Technical Analysis is about trading with the trend
Note: This technical analysis is for educational purposes. Please conduct your own analysis or consult a financial advisor before making investment decisions. The author of this article may hold long or short positions in the featured stocks or indexes. The article was written with the help of AI and was reviewed by an editor.
© 2026 TradeOnline.ca InvestOnline.ca ChartAnalysis.ca