Published December 8, 2025

The historical chart for the prime rate is included for reference:
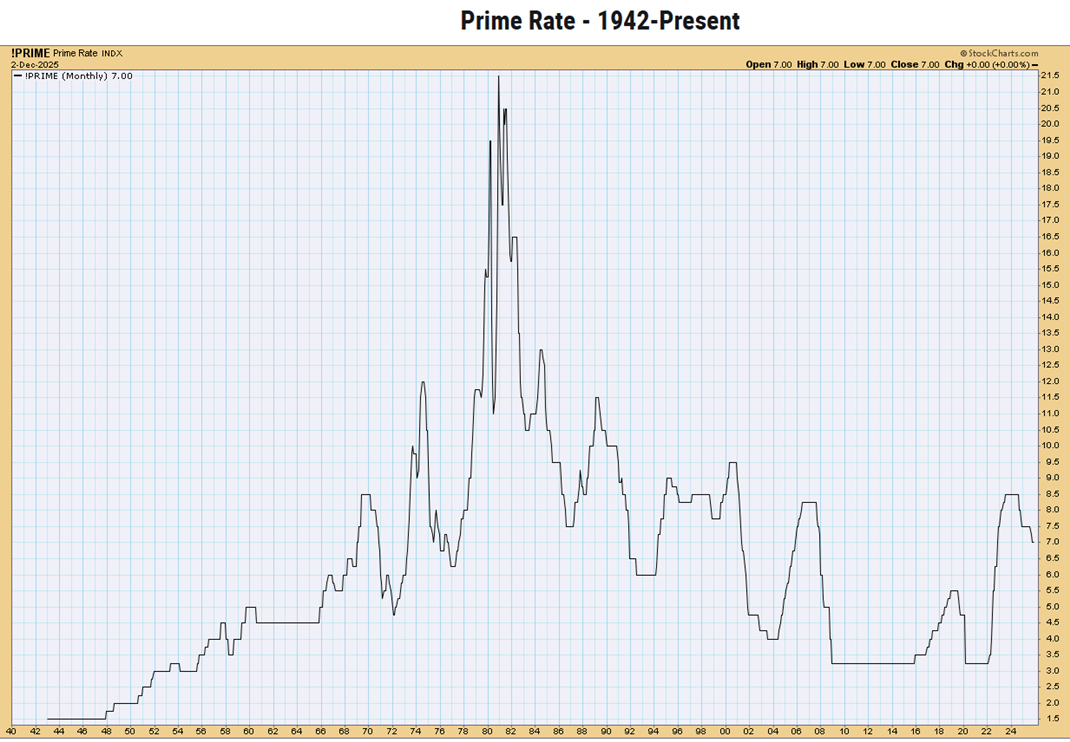
Key Market Indexes | Historical Chart Gallery | StockCharts.com
Published December 8, 2025
The historical chart for the prime rate is included for reference:
Key Market Indexes | Historical Chart Gallery | StockCharts.com
Published April 15, 2025
China is America’s second largest foreign creditor after Japan, holding about $760 billion in Treasury securities.

Published April 8, 2025
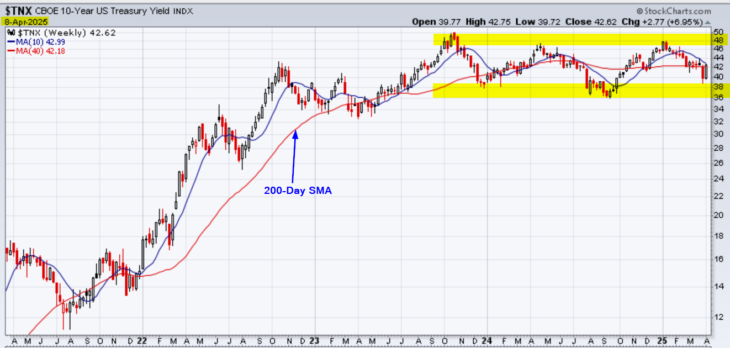
Trading in a major lateral trading range and will not change until there is more clarity on the tariffs. From a textbook perspective, money should be moving into the safety of the U.S. dollar which is the 10-year bond. This would push up the value of the bond and push down yields. The yield trades inversely to the the value of bond which has a fixed payout to maturity. This is not happening. Why? Investors worldwide maybe losing confidence in the U.S. dollar, the U.S. economy and the administration. Trump cannot take this lightly. As of March 2025, the total national debt of the United States is approximately $36.22 trillion. That is a a lot of debt to finance and long-term mortgage rates are tied to the 10-year bond. This is the major reason why Trump blinked on Wednesday. Yes, the U.S. dollar is the reserve currency but this comes with responsibilities.
The $28.6 trillion Treasury market is the lifeblood of the global financial system. Central banks and private financial institutions hold Treasuries of all maturities in huge quantities, and short-term Treasury debt is treated like cash. The bond selloff amounted to a decline in confidence in the U.S. itself.
https://www.investing.com/rates-bonds/u.s.-10-year-bond-yield
_____________
Note: This technical analysis is for educational purposes. Please conduct your own analysis or consult a financial advisor before making investment decisions. The author of this article may hold long or short positions in the featured stocks or indexes.
© 2025 TradeOnline.ca