Published April 9, 2025
Is this just a relief rally that will fade? The main negative tariff undercurrents still remain. Trump can change his mind on a daily basis or even a hourly basis! But, it was a strong move on above average volume. There needs to be confirmation of the move with follow-through over the next couple of days.
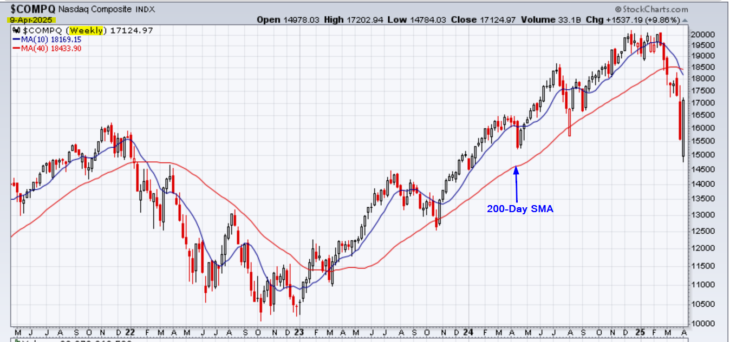
The following is a 4-year weekly chart before looking at the shorter-term daily chart:
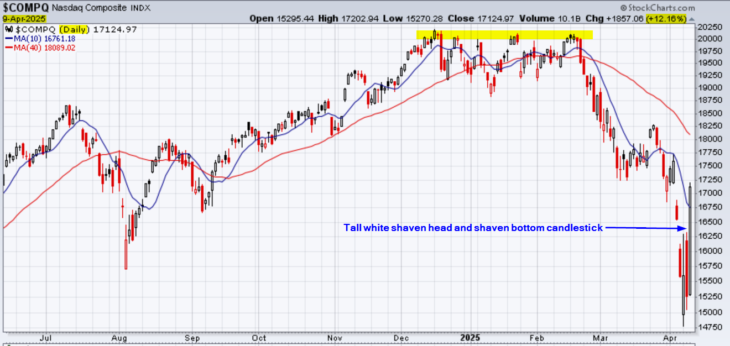
Here is the 10-month daily chart for Nasdaq showing the bullish shaven head and shaven bottom candlestick which represented a 12.16% upward move today:
https://www.mql5.com/en/forum/199205 detailing candlestick patterns.
Trump temporarily drops tariffs to 10% for most countries, hits China harder with 125% https://www.cnbc.com/2025/04/09/trump-announces-90-day-tariff-pause-for-at-least-some-countries.html
_____________
Technical Analysis is about trading with the trend
Note: This technical analysis is for educational purposes. Please conduct your own analysis or consult a financial advisor before making investment decisions. The author of this article may hold long or short positions in the featured stocks or indexes.
© 2025 TradeOnline.ca