Published March 30, 2026
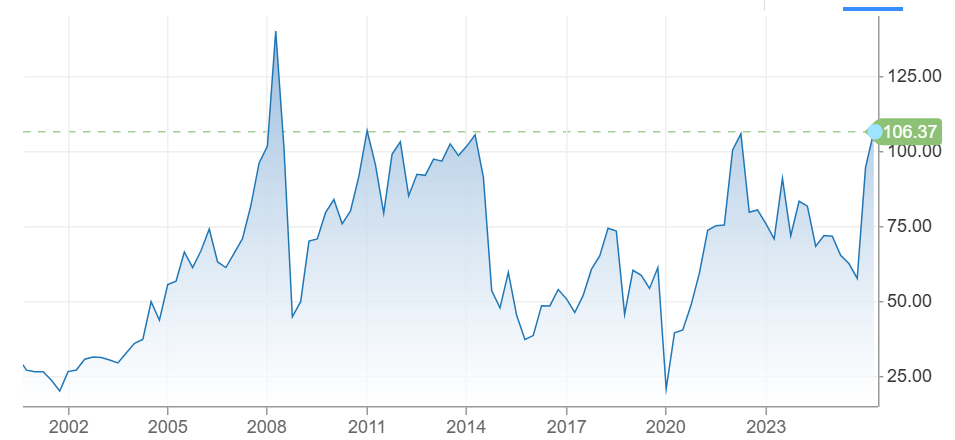
The 2008 oil price spike, which saw West Texas Intermediate (WTI) crude hit an all-time record of $147.27 per barrel in July, was a “perfect storm” of economic, geopolitical, and financial factors. It wasn’t caused by a single event, but rather a collision of supply and demand that many at the time called the “Third Oil Shock.”
Here is the breakdown of what drove prices into the stratosphere:
1. The “Demand Shock” (Emerging Giants)
The single biggest driver was the rapid industrialization of China and India.
- The Awakening: These two nations were growing at nearly 10% GDP, shifting millions of people into the middle class who were buying cars and using electricity for the first time.
- Inelasticity: Global demand was growing so fast that it didn’t matter if prices went up; these emerging economies needed the fuel to keep their factories running, creating a “bidding war” for every available barrel.
2. Stagnant Global Supply
While demand was skyrocketing, the world’s ability to pump more oil had hit a wall.
- Spare Capacity: Historically, Saudi Arabia kept enough “spare capacity” to flood the market if prices got too high. By 2008, that cushion had dwindled to almost nothing.
- Non-OPEC Struggles: Production in places like the North Sea and Mexico was in natural decline, and new projects (like deep-water drilling) were taking years longer than expected to come online.
- Peak Oil Fears: This was the era where the “Peak Oil” theory went mainstream—the fear that the world had already reached its maximum physical production limit.
3. Geopolitical Risk Premium
Investors added a “fear tax” to the price of oil due to constant instability in key producing regions:
- The Middle East: Continued fallout from the Iraq War and rising tensions with Iran over its nuclear program led to fears of a closure of the Strait of Hormuz.
- Nigeria: Militant attacks on pipelines in the Niger Delta frequently knocked hundreds of thousands of barrels per day offline.
- Venezuela: Political friction between the U.S. and Hugo Chávez’s government led to concerns about supply reliability from one of the U.S.’s biggest providers.
4. The Weakening U.S. Dollar
Oil is priced globally in U.S. Dollars ($USD$). In 2008, the dollar was losing value rapidly against the Euro and other currencies.
- The Hedge: When the dollar weakens, oil prices usually rise to compensate.
- Foreign Buyers: For a buyer in Europe using Euros, oil didn’t actually feel as “expensive” as it did to an American, because their currency was stronger. This kept global demand high even as prices in dollars soared.
5. Financial Speculation (“The Bubble”)
This is the most debated cause. Many analysts believe the “financialization” of commodities played a role.
- Index Funds: Huge amounts of pension fund and hedge fund money flowed into “commodity index funds.” These investors weren’t buying oil to use it; they were buying it as a financial asset.
- The Momentum: This created a feedback loop—as prices rose, more speculative money flowed in, pushing prices even higher until the bubble finally burst during the Great Financial Crisis later that year.
Comparison: 2008 vs. Today
| Factor | 2008 Peak ($147) | 2026 Context |
| Main Driver | China’s Industrialization | Geopolitical Conflict (ME/Ukraine) |
| Supply | Physical Scarcity Fears | Sufficient Supply (Shale/OPEC+) |
| US Dollar | Record Weakness | Generally Stronger |
| Demand | Rapidly Rising | Transitioning (EVs/Renewables) |
The spike ended abruptly in late 2008 when the global financial system collapsed. Demand vanished almost overnight, and oil plummeted from $147 to under $40 in just six months—one of the most violent “price destructions” in history.
Considering the recent spikes we’ve seen in WTI and HOU.TO, do you think today’s geopolitical tensions are creating a similar “fear premium” to what we saw in 2008?
_____________
Technical Analysis is about trading with the trend
Note: This technical analysis is for educational purposes. Please conduct your own analysis or consult a financial advisor before making investment decisions. The author of this article may hold long or short positions in the featured stocks or indexes. The article was written with the help of AI and was reviewed by an editor.
© 2026 TradeOnline.ca InvestOnline.ca ChartAnalysis.ca