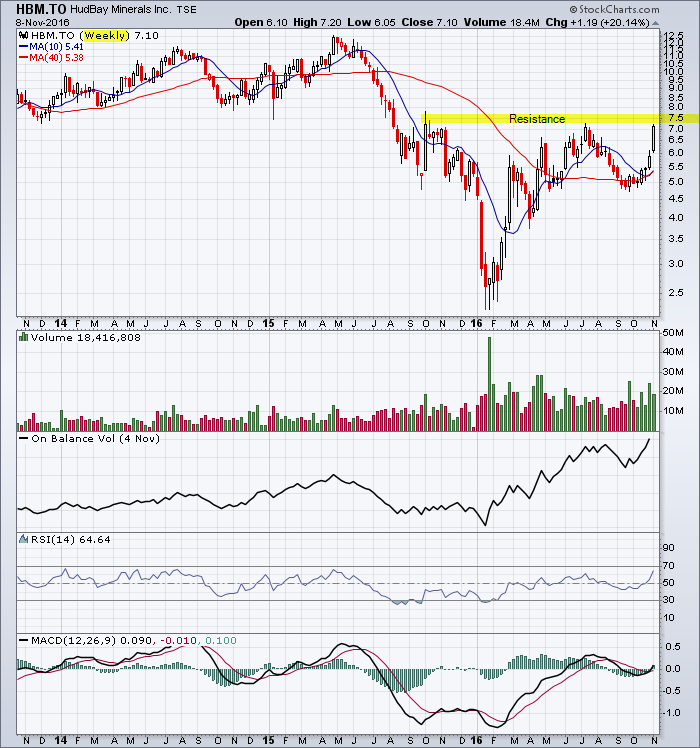
Author Archives: Trader

Teck Resources daily chart showing major uptrend

I featured Teck on December 17, 2015: A nice ride for one year!
Teck Resources Daily Chart

Teck Resources Daily Chart

https://tradeonline.ca/2015/12/17/is-this-the-bottom-for-teck-resources/

http://www.teck.com/investors/

______________________________

“Technical Analysis is about probabilities.”

Note: Click on HOME for updated postings. This technical analysis is for educational purposes so you can learn to trade online using candlestick charts and other technical indicators including volume, moving averages and oscillators. Please conduct your own chart analysis or consult your financial advisor before making investment decisions. The author of this article may hold long or short positions in the featured stock or index.

© 2016 TradeOnline.ca

Positive SSL on a transparent background

Fortis (FTS.TO) weekly chart showing major uptrend

Fortis has increased its dividend payment to common shareholders every year for 42 consecutive years, longer than any other Canadian public corporation.

Major uptrend for Fortis.

Fortis Weekly chart

https://www.fortisinc.com/investor-relations/faq

______________________________

“Technical Analysis is about probabilities.”

Note: Click on HOME for updated postings. This technical analysis is for educational purposes so you can learn to trade online using candlestick charts and other technical indicators including volume, moving averages and oscillators. Please conduct your own chart analysis or consult your financial advisor before making investment decisions. The author of this article may hold long or short positions in the featured stock or index.

© 2016 TradeOnline.ca

Positive SSL on a transparent background

Bank of America (BAC) will test major resistance of $18

Intermediate uptrend and near-term uptrend for BAC
Bank of America weekly chart showing the intermediate uptred.

BAC Weekly Chart

Bank of America Reports Third-Quarter 2016 Financial Results

______________________________

“Technical Analysis is about probabilities.”

Note: Click on HOME for updated postings. This technical analysis is for educational purposes so you can learn to trade online using candlestick charts and other technical indicators including volume, moving averages and oscillators. Please conduct your own chart analysis or consult your financial advisor before making investment decisions. The author of this article may hold long or short positions in the featured stock or index.

© 2016 TradeOnline.ca

Positive SSL on a transparent background

CRB Index up +22% from the February low

CRB Index Daily Chart

CRB Index Daily Chart

https://en.wikipedia.org/wiki/Thomson_Reuters/Jefferies_CRB_Index

______________________________

“Technical Analysis is about probabilities.”

Note: Click on HOME for updated postings. This technical analysis is for educational purposes so you can learn to trade online using candlestick charts and other technical indicators including volume, moving averages and oscillators. Please conduct your own chart analysis or consult your financial advisor before making investment decisions. The author of this article may hold long or short positions in the featured stock or index.

© 2016 TradeOnline.ca

Positive SSL on a transparent background

S&P 500 at major support around 2120

S&P 500 at major support around 2120

S&P 500 Daily Chart

Reference the last chart analysis for the S&P 500 Index.

______________________________

“Technical Analysis is about probabilities.”

Note: Click on HOME for updated postings. This technical analysis is for educational purposes so you can learn to trade online using candlestick charts and other technical indicators including volume, moving averages and oscillators. Please conduct your own chart analysis or consult your financial advisor before making investment decisions. The author of this article may hold long or short positions in the featured stock or index.

© 2016 TradeOnline.ca

Positive SSL on a transparent background

Breakout for Vale on above average volume

Vale moved +10.22% for the week
Breakout for Vale on the weekly candlestick chart.

Vale 3-Year Weekly Chart

http://www.vale.com/en/aboutvale/news/pages/3q16-financial-report.aspx

https://en.wikipedia.org/wiki/Vale_(mining_company)

______________________________

“Technical Analysis is about probabilities.”

Note: Click on HOME for updated postings. This technical analysis is for educational purposes so you can learn to trade online using candlestick charts and other technical indicators including volume, moving averages and oscillators. Please conduct your own chart analysis or consult your financial advisor before making investment decisions. The author of this article may hold long or short positions in the featured stock or index.

© 2016 TradeOnline.ca

Positive SSL on a transparent background

Breakout for Suncor (SU)

Suncor daily candlestick chart showing the breakout

http://www.suncor.com/en-CA/Newsroom/News-Releases/2098361

______________________________

“Technical Analysis is about probabilities.”

Note: Click on HOME for updated postings. This technical analysis is for educational purposes so you can learn to trade online using candlestick charts and other technical indicators including volume, moving averages and oscillators. Please conduct your own chart analysis or consult your financial advisor before making investment decisions. The author of this article may hold long or short positions in the featured stock or index.

© 2016 TradeOnline.ca

Positive SSL on a transparent background

10-Year U.S. Treasury Yield Note above 1.80%

Intermediate uptrend and near-term uptrend with resistance at 2.0%

10 Year Treasury Yield trading above 1.80%  which is above the 200 day moving average.

Reference the last chart analysis for the 10-Year Treasury Yield.

http://www.wsj.com/articles/selling-sweeps-global-government-bonds-u-s-10-year-yield-above-1-8-1477578343

______________________________

“Technical Analysis is about probabilities.”

Note: Click on HOME for updated postings. This technical analysis is for educational purposes so you can learn to trade online using candlestick charts and other technical indicators including volume, moving averages and oscillators. Please conduct your own chart analysis or consult your financial advisor before making investment decisions. The author of this article may hold long or short positions in the featured stock or index.

© 2016 TradeOnline.ca

Positive SSL on a transparent background