Can it hold major support around 1350?
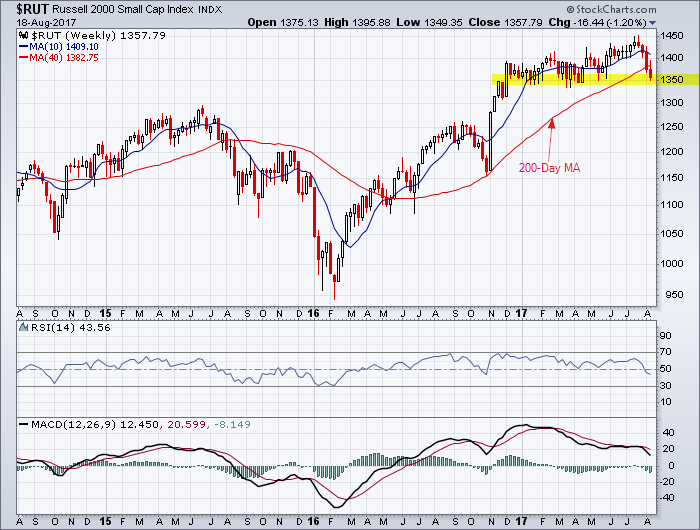
Russell 2000 3-Year Weekly Chart
______________________________
Can it hold major support around 1350?
Russell 2000 3-Year Weekly Chart
______________________________

Russell 2000 6-Month Daily Chart
______________________________
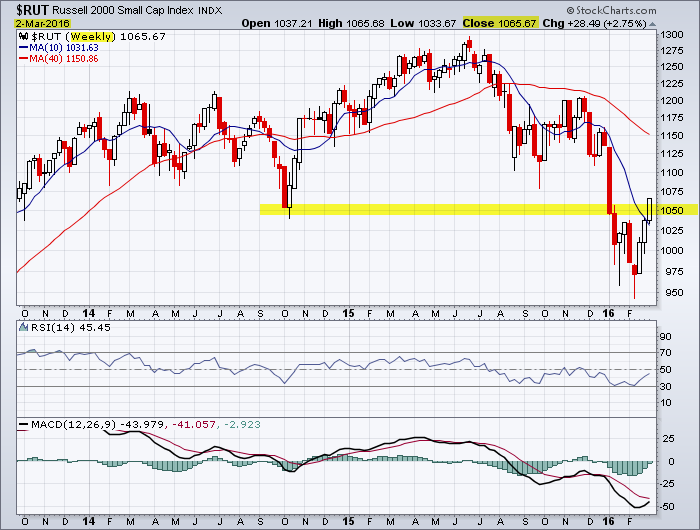
Russell 2000 3-Year Weekly Chart
Reference my post for the Russell 2000 published on January 12, 2016 identifying the fact that the index was in bear market territory.
______________________________
“Technical Analysis is about probabilities.”
Note: Click on HOME for updated postings. This technical analysis is for educational purposes so you can learn to trade online using candlestick charts and other technical indicators including volume, moving averages and oscillators. Please conduct your own chart analysis or consult your financial advisor before making investment decisions. The author of this article may hold long or short positions in the featured stock or index.
© 2016 TradeOnline.ca

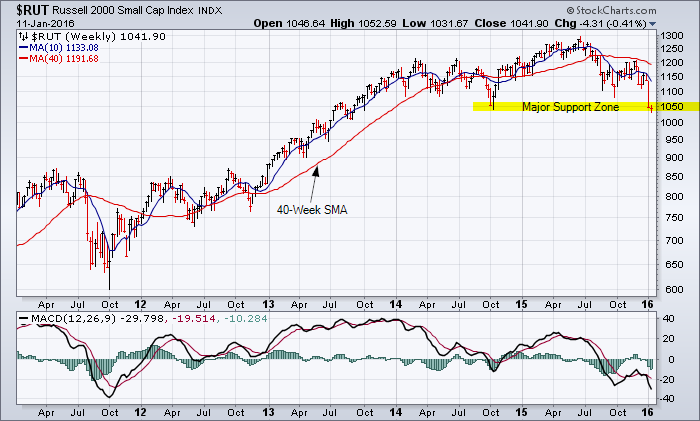
Russell 2000 5-Year Chart
______________________________
“Technical Analysis is about probabilities.”
Note: Click on HOME for updated postings. This technical analysis is for educational purposes so you can learn to trade online using candlestick charts and other technical indicators including volume, moving averages and oscillators. Please conduct your own chart analysis or consult your financial advisor before making investment decisions. The author of this article may hold long or short positions in the featured stock or index.
© 2016 TradeOnline.ca
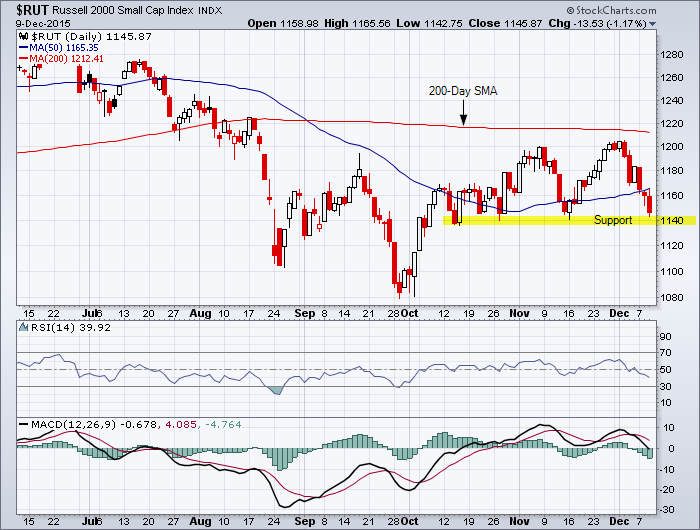
Russell 2000 6-Month Daily Chart
Reference last chart analysis for Russell 2000.
______________________________
“Technical Analysis is about probabilities.”
Note: Click on HOME for updated postings. This technical analysis is for educational purposes so you can learn to trade online using candlestick charts and other technical indicators including volume, moving averages and oscillators. Please conduct your own chart analysis or consult your financial advisor before making investment decisions. The author of this article may hold long or short positions in the featured stock or index.
© 2015 TradeOnline.ca

Russell 2000 6-Month Daily Chart
Reference the last chart analysis for the Russell 2000.
______________________________
“Technical Analysis is about probabilities.”
Note: Click on HOME for updated postings. This technical analysis is for educational purposes so you can learn to trade online using candlestick charts and other technical indicators including volume, moving averages and oscillators. Please conduct your own chart analysis or consult your financial advisor before making investment decisions. The author of this article may hold long or short positions in the featured stock or index.
© 2015 TradeOnline.ca

Russell 2000 3-year Weekly Chart
Near-term uptrend for Russell 2000. Bullish shaven head and shaven bottom candlestick for the week. Will test 1200. Trade this one with the iShares Russell 2000 ETF.
______________________________
“It is all about probabilities”
Note: Click on HOME for updated postings. This technical analysis is for educational purposes so you can learn to trade online using candlestick charts and other technical indicators including volume, moving averages and oscillators. Please conduct your own chart analysis or consult your financial advisor before making investment decisions. The author of this article may hold long or short positions in the featured stock or index.
© 2014 TradeOnline.ca
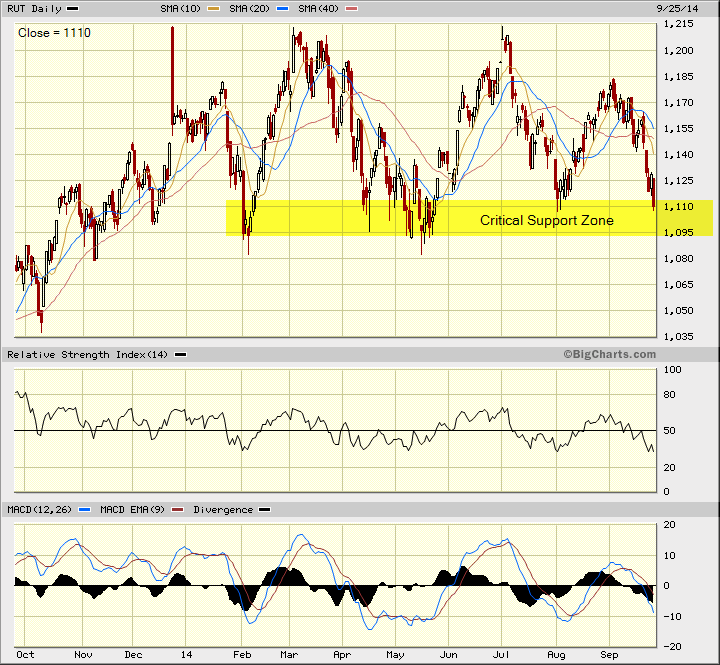
Russell 2000 1-Year Chart
Reference my last chart analysis for the Russell 2000 published May 19, 2014. We are back to the same major test of critical support.
______________________________
“Keep it Simple!”
Note: Click on HOME for updated postings. This technical analysis is for educational purposes so you can learn to trade online using candlestick charts and other technical indicators including volume, moving averages and oscillators. Please conduct your own chart analysis or consult your financial advisor before making investment decisions. The author of this article may hold long or short positions in the featured stock or index.