The doji star is a potent warning when it appears after a sustained uptrend. It is a yellow light indicating caution. It appeared right below major resistance at the 200-day moving average. Monitor the price action on Tuesday for the possible formation of the evening doji star which is an open below the doji and a close deep into the prior white candlestick. This formation would put the brakes on the near-term uptrend for copper.
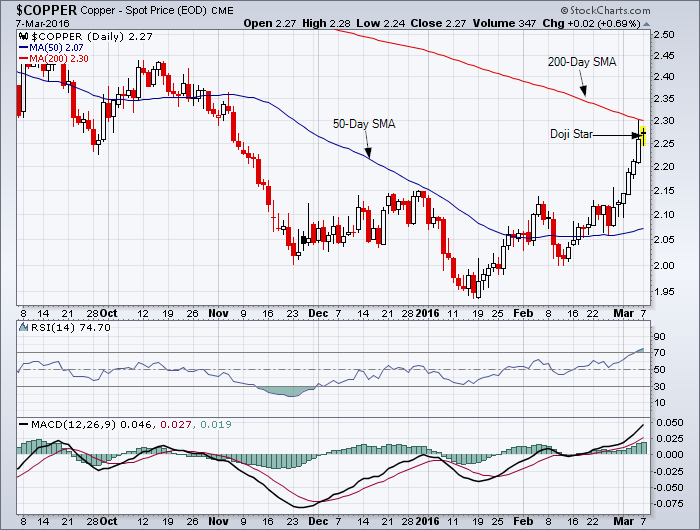
Copper 6-Month Daily Chart
Reference my last chart analysis for copper.
StockCharts.com has a concise summary of the candlestick patterns.
Evening Doji Star: A three day bearish reversal pattern similar to the Evening Star. The uptrend continues with a large white body. The next day opens higher, trades in a small range, then closes at its open (Doji). The next day closes below the midpoint of the body of the first day.

______________________________
“If you dither, you lose”
Note: Click on HOME for updated postings. This technical analysis is for educational purposes so you can learn to trade online using candlestick charts and other technical indicators including volume, moving averages and oscillators. Please conduct your own chart analysis or consult your financial advisor before making investment decisions. The author of this article may hold long or short positions in the featured stock or index.
© 2016 TradeOnline.ca
