Technical Analysis is about trading with the trend
Note: This technical analysis is for educational purposes. Please conduct your own analysis or consult a financial advisor before making investment decisions. The author of this article may hold long or short positions in the featured stocks or indexes.
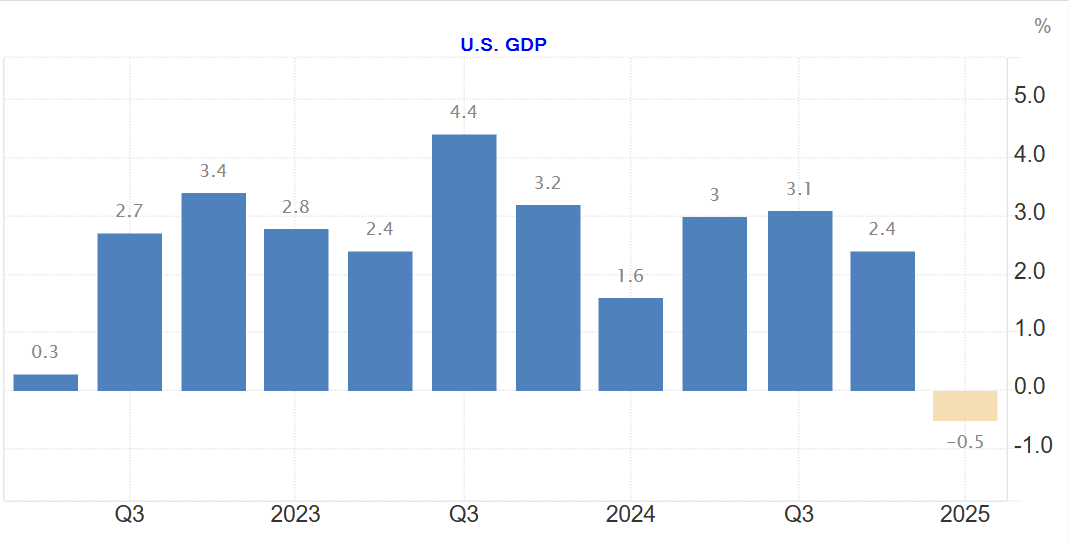
Analysis: First-quarter growth sank under a surge of imports as companies in the United States rushed to bring in foreign goods before Trump could impose tariffs on them. Trade deficits reduce GDP. But that’s just a matter of mathematics. GDP is supposed to count only what’s produced domestically, not stuff that comes in from abroad. So imports – which show up in the GDP report as consumer spending or business investment – have to be subtracted out to keep them from artificially inflating domestic production.
The first-quarter import influx likely won’t be repeated in the April-June quarter and therefore shouldn’t weigh on GDP. In fact, economists expect second-quarter growth to bounce back to 3 per cent in the second quarter, according to a survey of forecasters by the data firm FactSet.
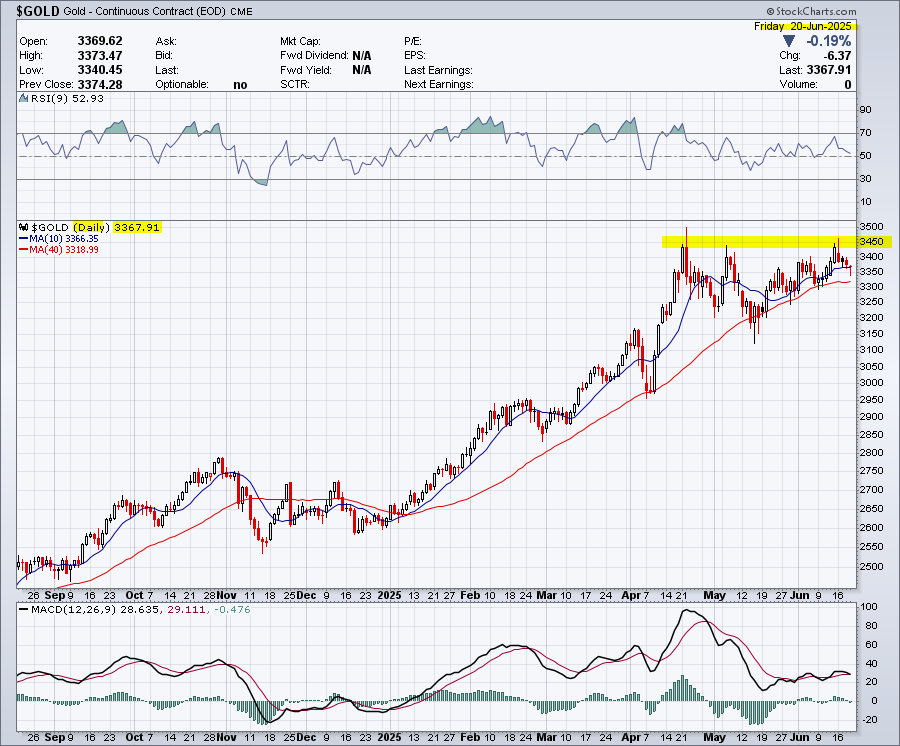
Analysis: Gold has tested the 3450 price zone three times. Monitor the consolidation zone for a breakdown below major support around 3150. Divergence is also apparent in the RSI indicator and MACD.
_____________
Technical Analysis is about trading with the trend
Note: This technical analysis is for educational purposes. Please conduct your own analysis or consult a financial advisor before making investment decisions. The author of this article may hold long or short positions in the featured stocks or indexes.
Analysis: The major trend is down with a near-term uptrend for WTIC. On the plus side, oil is trading above the 200-day moving average. It will meet major resistance around $80. Movements will be predicated on the volatile situation in the Middle East.
_____________
Technical Analysis is about trading with the trend
Note: This technical analysis is for educational purposes. Please conduct your own analysis or consult a financial advisor before making investment decisions. The author of this article may hold long or short positions in the featured stocks or indexes.
Here is a 4-year weekly chart showing the major downtrend and the intermediate and near-term uptrends. It is trading above the 200-day moving average and the 50-day has crossed above the 200-day.
The Enduring Dance of Gold and Silver: A Tale of Two Precious Metals
Gold and silver, often dubbed “precious metals,” have captivated humanity for millennia, serving as currencies, symbols of wealth, and industrial essentials. While both hold inherent value and are sought after by investors, their relationship is a dynamic and often intriguing one, marked by both parallel movements and distinct divergences.
Historically, silver’s abundance meant it frequently served as a transactional currency, the “money of the common man,” while gold, rarer and more difficult to acquire, was the preserve of empires and elite wealth. This historical division of labour continues to subtly influence their modern relationship.
Similarities in Motion:
At a fundamental level, both gold and silver are considered safe-haven assets. In times of economic uncertainty, geopolitical instability, or inflationary pressures, investors often flock to both metals as stores of value, leading to their prices often moving in tandem. They are both tangible assets, outside the direct control of governments or central banks, offering a hedge against currency depreciation. Mining costs, geopolitical events impacting supply, and shifts in global demand for precious metals can also influence both markets in similar ways.
Distinctive Drivers and Divergent Paths:
Despite their shared characteristics, key differences often lead to their prices diverging:
Industrial Demand: This is perhaps the most significant differentiator. While gold’s industrial applications are relatively niche (primarily electronics and dentistry), silver is an indispensable industrial metal. Its superior conductivity, malleability, and reflectivity make it crucial in solar panels, electronics (from smartphones to electric vehicles), medical devices, and photography. This industrial demand makes silver more sensitive to economic cycles; when the global economy is booming, industrial demand for silver typically rises, often outpacing gold’s gains. Conversely, an economic slowdown can hit silver harder.
Monetary vs. Industrial Role: Gold is overwhelmingly viewed as a monetary metal, its value tied to its historical role as currency and a hedge against systemic risk. Silver, while also a precious metal, is often seen as having a dual identity: part monetary asset, part industrial commodity. This dual nature can make silver more volatile than gold.
Supply Dynamics: Silver is typically mined as a byproduct of other metals (like copper, lead, and zinc), meaning its supply is less responsive to its own price movements compared to gold, which is primarily mined for its own sake.
Price Volatility and “Poor Man’s Gold”: Due to its lower price point and higher industrial correlation, silver tends to be more volatile than gold. It often experiences larger percentage gains during bull markets for precious metals, earning it the nickname “poor man’s gold” as a more accessible entry point for investors. However, this also means it can suffer larger percentage losses during downturns.
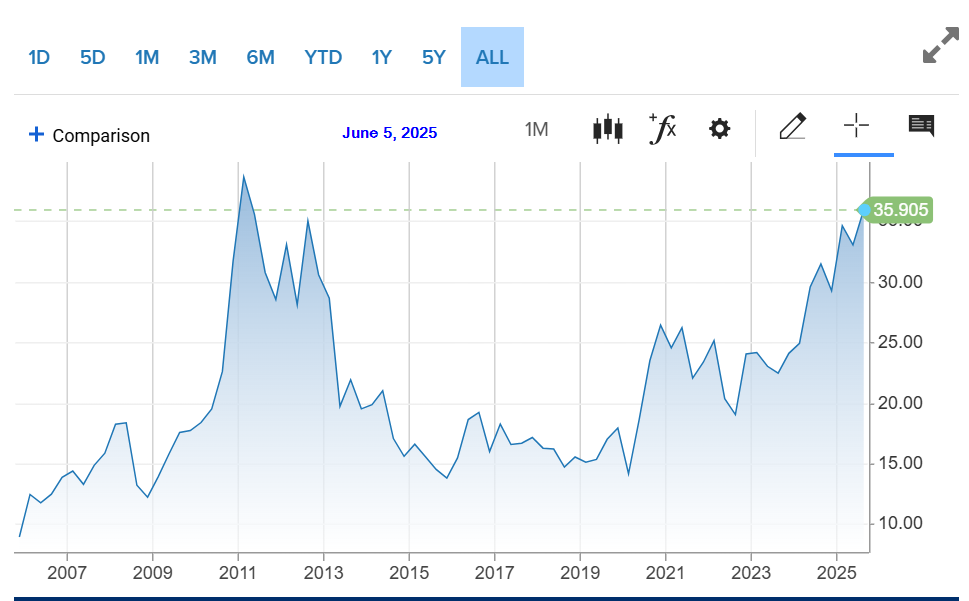
The Gold/Silver Ratio: A popular metric among investors is the gold/silver ratio, which indicates how many ounces of silver it takes to buy one ounce of gold. This ratio fluctuates, and traders often use it to gauge which metal might be undervalued relative to the other, making investment decisions based on historical averages or trends in the ratio.
In conclusion, the relationship between gold and silver is one of complex interdependence. While they often move in the same general direction due to their safe-haven status, silver’s significant industrial utility introduces an additional layer of economic sensitivity, making it a more volatile and perhaps more dynamic play. Understanding these nuances is key to appreciating the enduring dance of these two valuable metals in the global economy.
Published with the help of AI and reviewed by an editor.
_____________
Technical Analysis is about trading with the trend
Note: This technical analysis is for educational purposes. Please conduct your own analysis or consult a financial advisor before making investment decisions. The author of this article may hold long or short positions in the featured stocks or indexes.
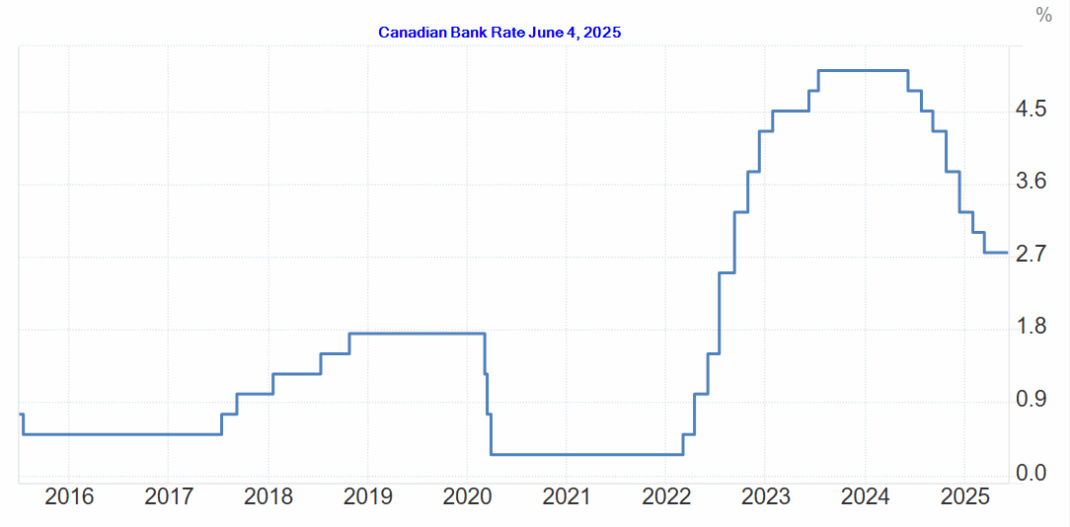
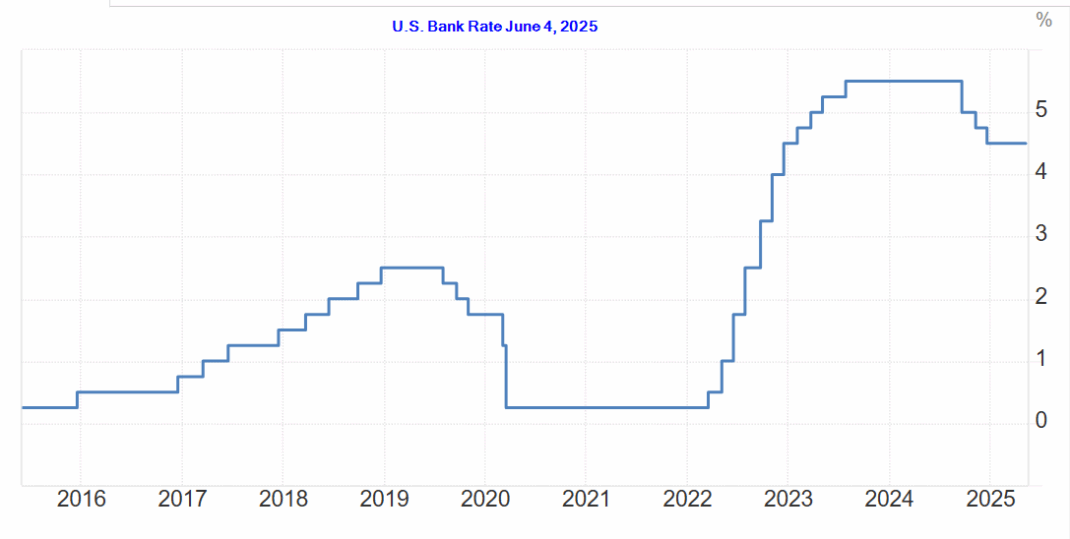
Analysis: This marks the second hold following 2.25 percentage points of cuts in seven consecutive decisions. The Canadian rate is 1.75% below the US rate which puts pressure on the value of the Canadian dollar. The prime rate charged to consumers and businesses is about 2.00% above the bank rate.
Here is a 10-year chart of the Canadian bank rate:
Here is the 10-year chart for the US bank rate which stands at 4.50% and represents a differential of 1.75% compared to the Canadian bank rate:
We use cookies to ensure that we give you the best experience on our website. If you continue to use this site we will assume that you are happy with it.