Published May 23, 2025
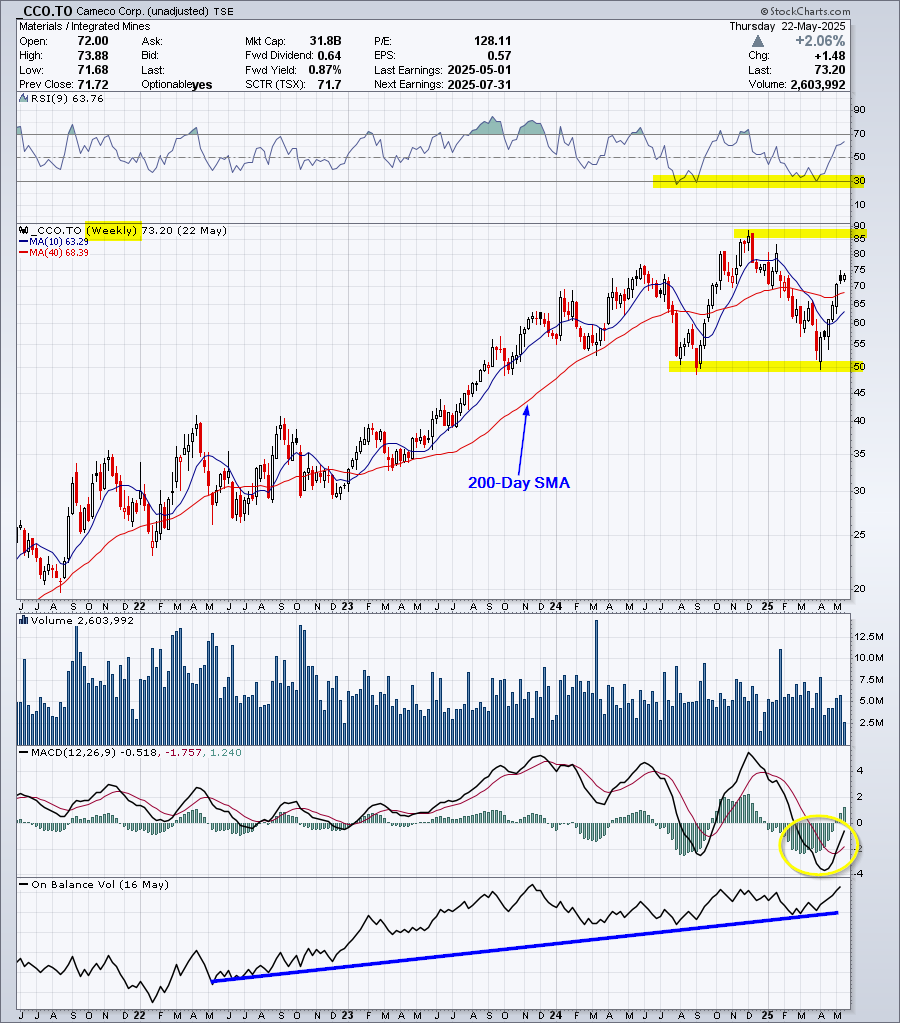
Cameco will test the $85 zone near the 2024 high
https://www.nytimes.com/2025/05/23/climate/trump-executive-order-nuclear-power.html
_____________
Technical Analysis is about trading with the trend
Note: This technical analysis is for educational purposes. Please conduct your own analysis or consult a financial advisor before making investment decisions. The author of this article may hold long or short positions in the featured stocks or indexes.
© 2025 TradeOnline.ca
Contact: [email protected]