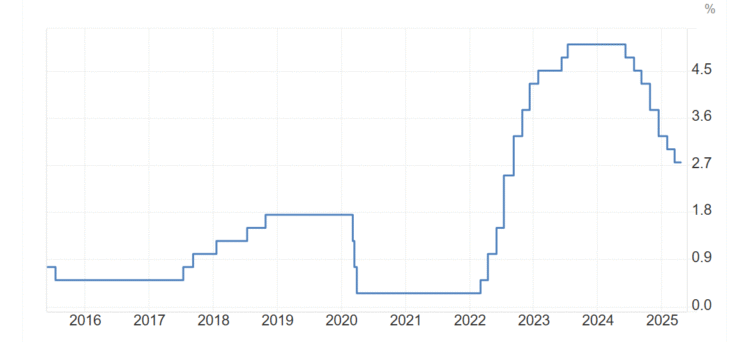
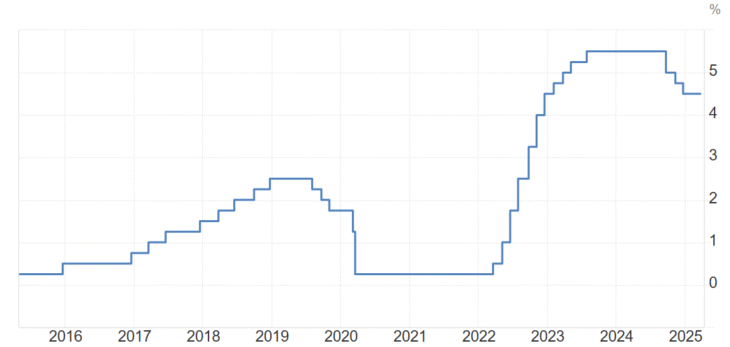
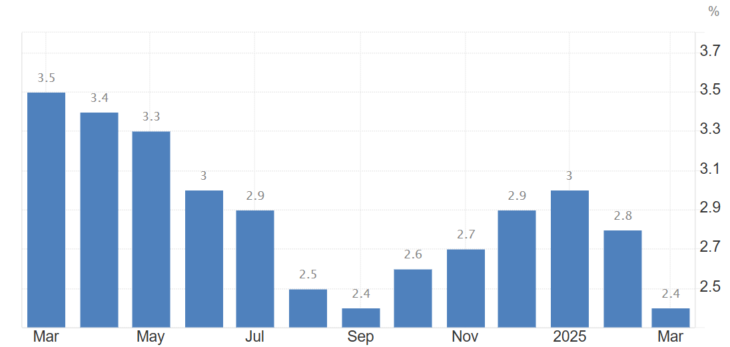
The current U.S. federal funds rate is between 4.25% and 4.50%. This rate is set by the Federal Reserve and influences other interest rates in the economy.
Here is a 10-year chart of United States Fed Funds Interest Rate:
Published April 10, 2025 and last updated April 24, 2025
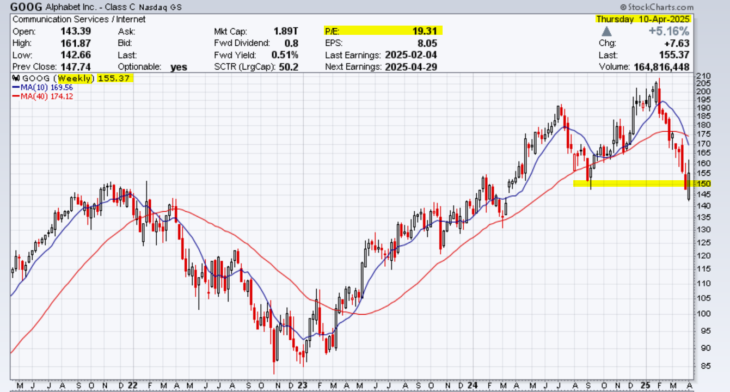
Alphabet is down around 30% from the high. It has a solid advertising and cloud business for top-line growth and performs on the bottom-line. Reference my spreadsheet analysis below this chart.
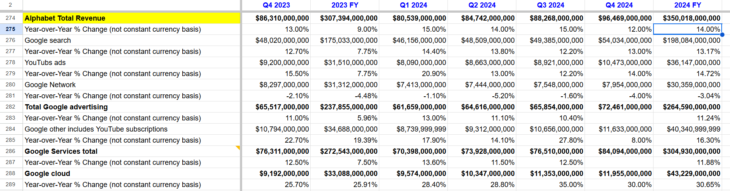
The following are the top-line numbers for Google from 2023 to 2024:
MOUNTAIN VIEW, Calif. – April 24, 2025 – Alphabet Inc. (NASDAQ: GOOG, GOOGL) today announced financial results for the quarter ended March 31, 2025.
Consolidated Alphabet revenues in Q1 2025 increased 12%, or 14% in constant currency, year over year to $90.2 billion reflecting robust momentum across the business, with Google Search & other, YouTube ads, Google subscriptions, platforms, and devices, and Google Cloud each delivering double-digit growth rates.
Google Services revenues increased 10% to $77.3 billion, reflecting strong performance across Google Search & other, Google subscriptions, platforms, and devices, and YouTube ads.
Google Cloud revenues increased 28% to $12.3 billion, led by growth in Google Cloud Platform (GCP) across core GCP products, AI Infrastructure, and Generative AI Solutions.
Total operating income increased 20% and operating margin expanded by 2 percentage points to 34%.
Net income increased 46% and EPS increased 49% to $2.81.
The company announced a 5% increase to the dividend, resulting in a quarterly cash dividend of $0.21.
Technical Analysis is about trading with the trend
Note: This technical analysis is for educational purposes. Please conduct your own analysis or consult a financial advisor before making investment decisions. The author of this article may hold long or short positions in the featured stocks or indexes.
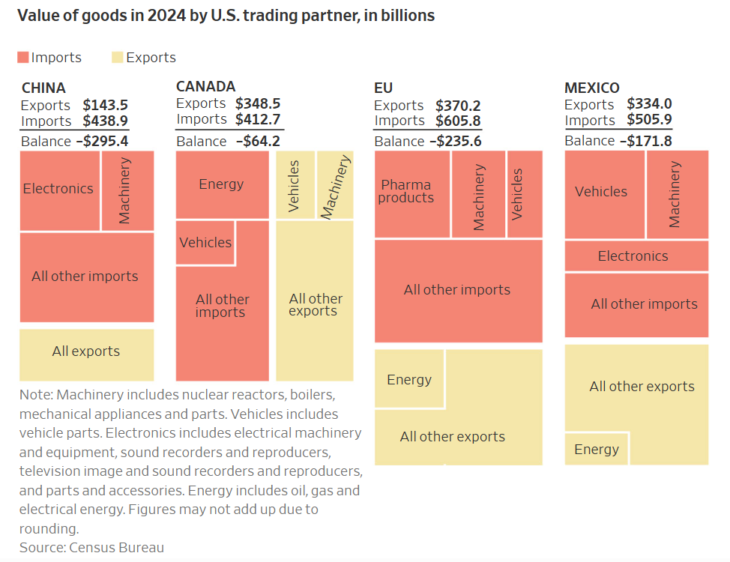
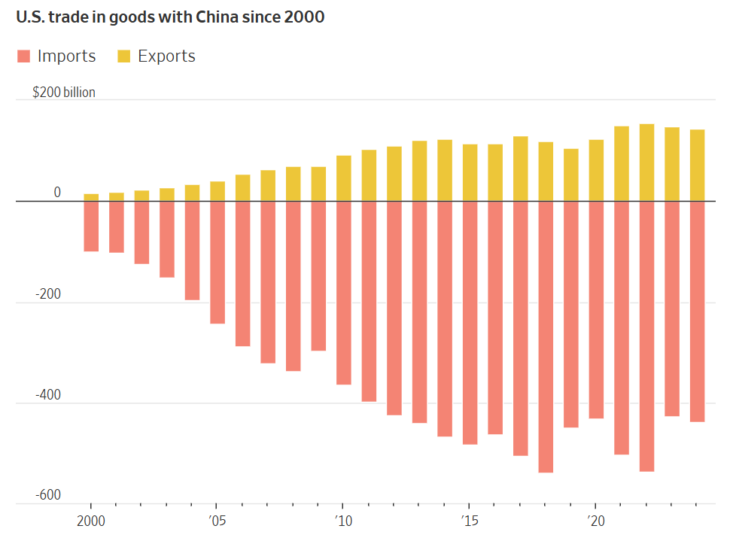
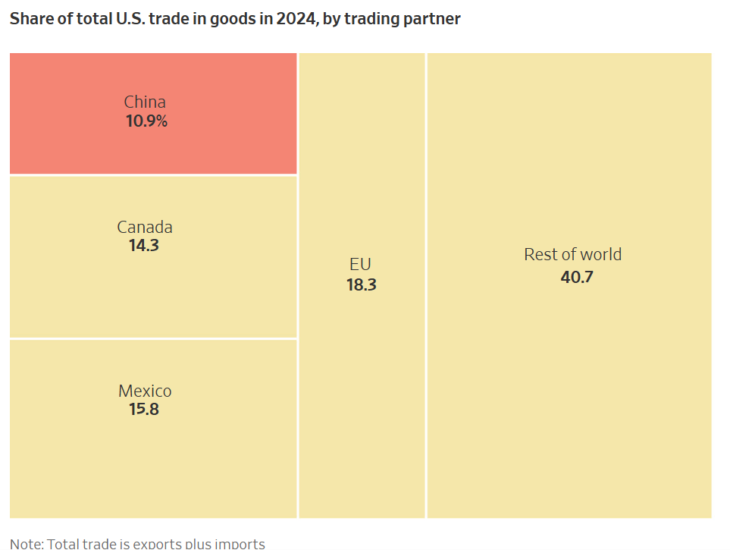
Goods from China represented 13.3% of total U.S. imports, making China the third-largest supplier of goods to the U.S. Products such as smartphones, computers, toys and videogame consoles accounted for 55.5% of U.S. imports from China.
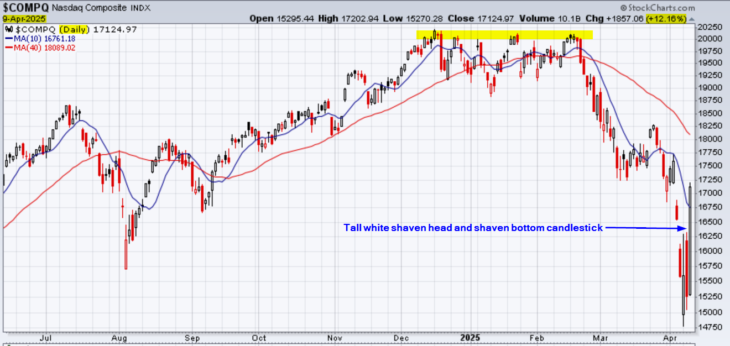
Is this just a relief rally that will fade? The main negative tariff undercurrents still remain. Trump can change his mind on a daily basis or even a hourly basis! But, it was a strong move on above average volume. There needs to be confirmation of the move with follow-through over the next couple of days.
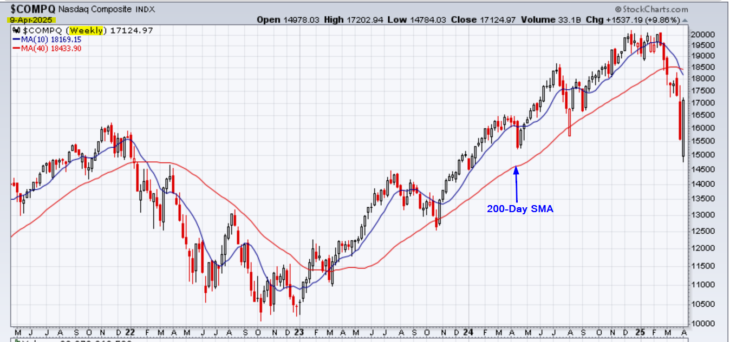
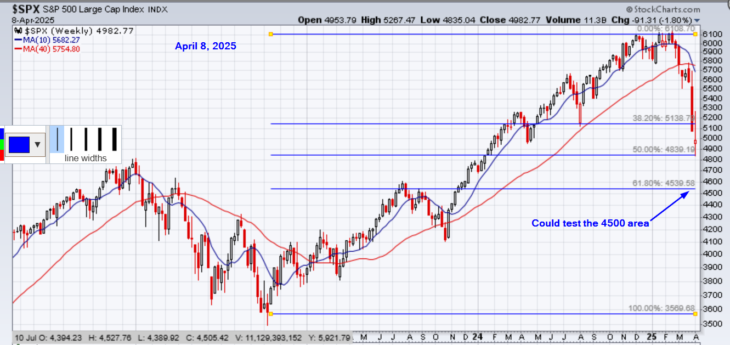
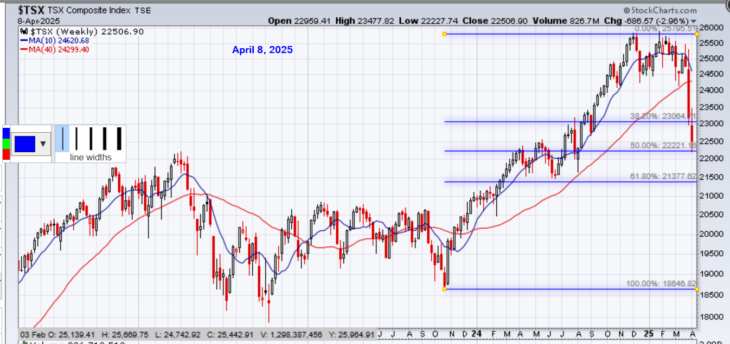
The following is a 4-year weekly chart before looking at the shorter-term daily chart:
Here is the 10-month daily chart for Nasdaq showing the bullish shaven head and shaven bottom candlestick which represented a 12.16% upward move today:
Technical Analysis is about trading with the trend
Note: This technical analysis is for educational purposes. Please conduct your own analysis or consult a financial advisor before making investment decisions. The author of this article may hold long or short positions in the featured stocks or indexes.
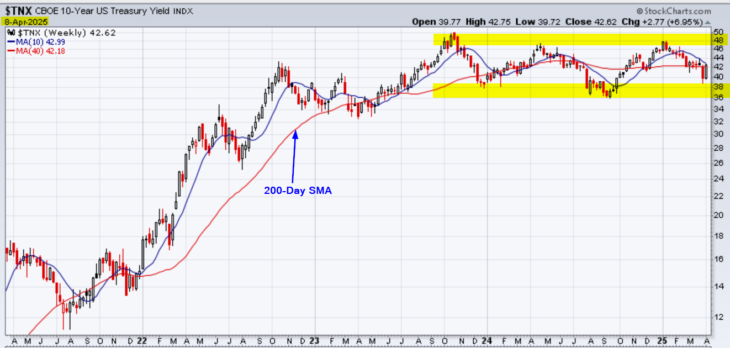
Trading in a major lateral trading range and will not change until there is more clarity on the tariffs. From a textbook perspective, money should be moving into the safety of the U.S. dollar which is the 10-year bond. This would push up the value of the bond and push down yields. The yield trades inversely to the the value of bond which has a fixed payout to maturity. This is not happening. Why? Investors worldwide maybe losing confidence in the U.S. dollar, the U.S. economy and the administration. Trump cannot take this lightly. As of March 2025, the total national debt of the United States is approximately $36.22 trillion. That is a a lot of debt to finance and long-term mortgage rates are tied to the 10-year bond. This is the major reason why Trump blinked on Wednesday. Yes, the U.S. dollar is the reserve currency but this comes with responsibilities.
The $28.6 trillion Treasury market is the lifeblood of the global financial system. Central banks and private financial institutions hold Treasuries of all maturities in huge quantities, and short-term Treasury debt is treated like cash. The bond selloff amounted to a decline in confidence in the U.S. itself.
Technical Analysis is about trading with the trend
Note: This technical analysis is for educational purposes. Please conduct your own analysis or consult a financial advisor before making investment decisions. The author of this article may hold long or short positions in the featured stocks or indexes.
We use cookies to ensure that we give you the best experience on our website. If you continue to use this site we will assume that you are happy with it.