Author Archives: Trader

As of January 21, 2026, GoDaddy (NYSE: GDDY) is in a precarious position

Published January 21, 2026

The stock is currently in the middle of a severe correction, trading near 52-week lows despite posting what looked like solid financial numbers in Q3 2025.

GDDY

Here is a a 3-year weekly chart showing the major downtrend:
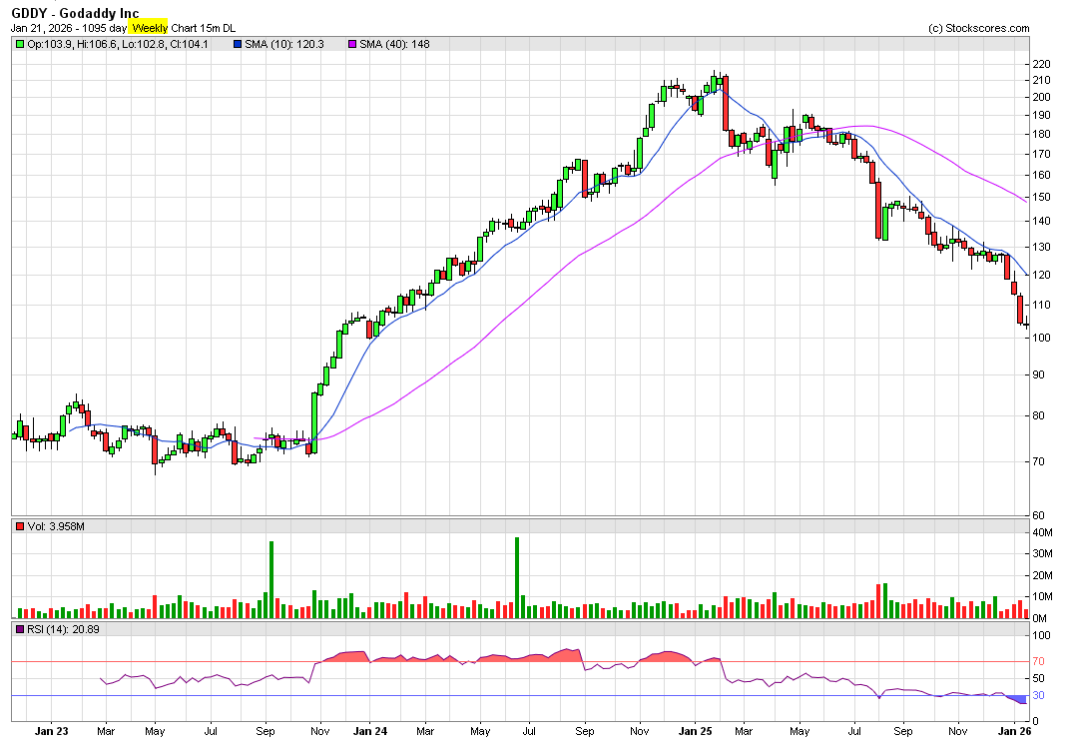
GoDaddy 3-year weekly chart

Here is a screenshot of my spreadsheet for GoDaddy:
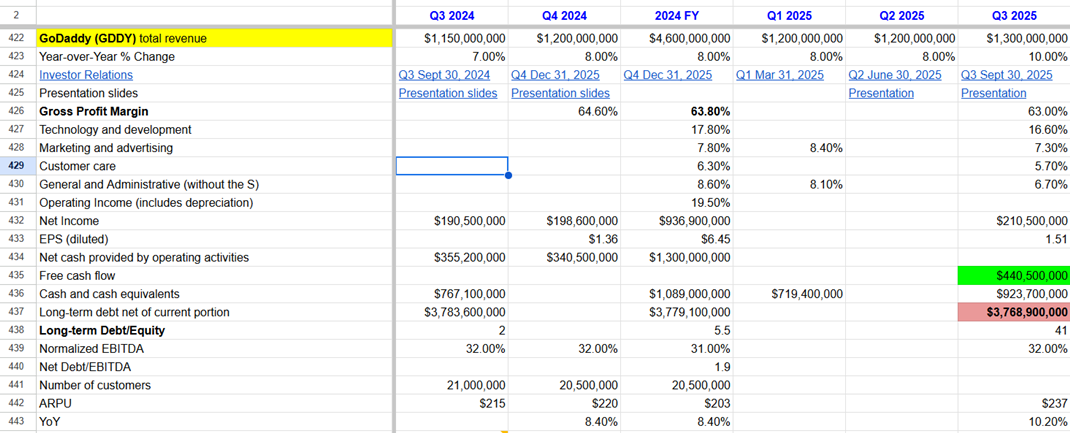
GoDaddy financials

_____________

Here is the “Executive Summary” of the situation: Wall Street is punishing the stock because it views GoDaddy as a “Legacy” tech company falling behind in the AI race, even though its current cash flow remains strong.

1. Stock Performance Snapshot (Jan 2026)

The stock chart is ugly right now. GoDaddy has been one of the poorer performers in the tech sector to start 2026.

  • Current Price: ~$104.00 – $105.00 USD
  • Trend: Aggressive Downtrend. The stock is down roughly 14–16% year-to-date (Jan 1–21) and has nearly cut in half from its 2025 highs of ~$216.
  • Market Cap: ~$14.8 Billion
  • 52-Week Range: $104.03 (Low) – $216.00 (High)
  • Recent Catalyst: In the first two weeks of January, multiple analysts (Morgan Stanley, Jefferies, Cantor Fitzgerald) cut their price targets, citing concerns that GoDaddy’s “Airo” AI product isn’t generating revenue fast enough to offset slowing domain growth.

2. Financial Health (The “Disconnect”)

This is the confusing part for many investors. If you look only at the income statement, the company looks fine. The sell-off is driven by sentiment and future growth fears, not current bankruptcy risk.

  • Revenue (Q3 2025):$1.32 Billion (+10% Year-over-Year).
    • Status: Growing, but “boring” single-digit to low-double-digit growth.
  • Profitability (EPS): $1.51 per share (Beat expectations of $1.48).
  • Free Cash Flow:$440.5 Million (+21% YoY).
    • Critical Stat: GoDaddy is a cash-generating machine. They are generating over $1.2 Billion in free cash flow annually.
  • Valuation:
    • P/E Ratio: ~15x – 18x (This is considered “cheap” for tech, suggesting it is trading like a utility company rather than a growth stock).

3. The “Bear Case” (Why is it crashing?)

Investors are fleeing the stock for three specific reasons in 2026:

  1. The “AI Loser” Narrative: The market fears that Generative AI (like ChatGPT or heavily funded startups) will make it too easy for people to build websites without GoDaddy. GoDaddy launched its own AI tool (GoDaddy Airo) to fight this, but early 2026 data suggests adoption hasn’t been the “game changer” investors wanted.
  2. Insider Selling: In early January 2026, key executives (including the Chief Strategy Officer) sold shares. While often routine, doing so during a stock slide spooked retail investors.
  3. Domain Saturation: The “Core Platform” (selling domain names) is a mature, low-growth business. Investors are looking for 20%+ growth, and GoDaddy is giving them 7–8%.

4. Upcoming Catalyst: Q4 Earnings

  • Estimated Date: Late February 2026 (Likely around Feb 13–15).
  • What to Watch:
    • Guidance for 2026: This is the only thing that matters. If they guide for revenue growth below 6%, the stock could break under $100.
    • Share Buybacks: Because the stock is so “cheap” (low P/E), management has been aggressively buying back their own stock. Watch to see if they announce a new, massive buyback authorization to defend the stock price.

Summary Strategy

  • The Bull View: You are buying a cash-cow monopoly at a discount (~$104). The fear is overblown, and their cash flow will fund massive buybacks that force the stock up eventually.
  • The Bear View: This is a “Value Trap.” It looks cheap, but revenue growth is permanently slowing because AI is making their core business model (selling website templates) obsolete.

As of January 21, 2026, the competitive landscape has thinned out significantly. The most important update for your comparison is that Squarespace is gone from the public markets, leaving GoDaddy and Wix as the last two major standalone “Website Builder” stocks.

Here is how GoDaddy stacks up against its primary rival (Wix) and the premium e-commerce giant (Shopify) in this current market correction.

1. The “Missing” Competitor: Squarespace (SQSP)

  • Status: Private / Delisted.
  • What happened: Squarespace was acquired by the private equity firm Permira in late 2024 for roughly $7.2 billion.
  • Implication: You can no longer buy Squarespace stock. This actually helps GoDaddy’s “scarcity value”—if an investor wants exposure to the “Do-It-Yourself Website” sector, they essentially have to choose between GoDaddy and Wix.

2. Head-to-Head: GoDaddy (GDDY) vs. Wix (WIX)

This is the main battle. Both stocks are currently down, but for different reasons.

FeatureGoDaddy (GDDY)Wix.com (WIX)
Stock Price~$104 USD~$76 – $80 USD
Valuation (P/E)~15x – 16x (Value Stock)~30x – 34x (Growth Stock)
The “Vibe”“The Cash Cow”“The Fallen Star”
Why it’s downFear of AI obsolescence; slow growth.Valuation compression; losing premium status.
Cash FlowMassive (~$1.2B/year).Growing, but less stable than GDDY.

The Analysis:

  • GoDaddy is the “Safe” Play: It trades at half the valuation of Wix (15x vs 30x). Wall Street treats it like a utility company—boring, reliable cash flow, low growth.
  • Wix is the “High Beta” Play: Wix is trading at a much higher premium because it historically grew faster. However, its stock has crashed harder recently (down significantly from its 52-week highs of ~$230) as investors question if it deserves that premium in an AI world.

3. The “Premium” Alternative: Shopify (SHOP)

While not a direct competitor for “simple” websites, Shopify is often grouped in the same basket.

  • Price: ~$167 USD
  • Status: The clear leader. While GoDaddy and Wix fight for the “small local business” market (Pizza shops, Plumbers), Shopify owns the “Online Retail” market.
  • Valuation: Extremely expensive compared to GDDY. You pay a massive premium for Shopify because its growth is structurally higher.

Summary Comparison Table (Jan 2026)

CompanyStatusValuation RiskPrimary Investor Fear
GoDaddyPublicLow (Cheap at 15x P/E)“Will AI replace domain names?”
WixPublicHigh (Expensive at 30x P/E)“Can they justify this premium?”
SquarespacePrivateN/ATaken private to fix issues away from public eye.
ShopifyPublicMedium (Priced for perfection)“Consumer spending recession.”

Strategic Conclusion

  • If you want “Value”: GoDaddy is arguably the safest bet. Even if it doesn’t grow fast, the massive share buybacks (funded by that $1.2B cash flow) put a “floor” under the stock price around $95–$100.
  • If you want “Rebound Potential”: Wix has fallen so far that a simple earnings beat could send it up 20% in a day. It is the riskier, higher-reward trade.

As of January 2026, the short interest data for GoDaddy (GDDY) tells a very specific story: This is NOT a “hated” stock.

Despite the ugly stock chart, hedge funds are not aggressively betting on GoDaddy’s collapse. The selling pressure you are seeing is likely coming from “Long Only” funds selling their shares (profit-taking or rotation), rather than short sellers piling in.

Here is the breakdown of the data found for mid-January 2026.

1. The “Headline” Number

  • Short Interest (% of Float): ~4.2%
  • The Verdict:Low / Normal.
    • Context: A “Crowded Short” (like GameStop in 2021 or a failing bank) typically has short interest above 20%.
    • Peer Comparison: GoDaddy is actually shorted less than its peer group average (which hovers around ~8–9%). This means Wall Street sees GoDaddy as safer than many other mid-cap tech stocks.

2. The “Squeeze” Indicator (Days to Cover)

  • Days to Cover: ~4.1 to 4.5 Days
  • What this means: If all the short sellers decided to cover (buy back) their shares at once, it would take them roughly 4.5 days of normal trading volume to do it.
  • Analysis: This is moderately elevated.
    • Usually, anything over 5 days is considered “Squeeze Territory.”
    • While not extreme, a 4.5 ratio means that if GoDaddy releases a surprise positive earnings report in February, the stock could “pop” 10–15% very quickly because those short sellers would scramble to get out.

3. Institutional Ownership (The “Smart Money”)

  • Ownership: >90% (Very High).
  • The Player: The biggest holders are the “Big Three” (Vanguard, BlackRock, State Street).
  • The Signal: When institutional ownership is this high, it confirms that the stock is widely held in pension funds and ETFs. The recent price drop is likely due to ETF rebalancing or sector rotation (funds selling “Tech” to buy “Energy” or “Defense”), rather than a loss of faith in the company itself.

Summary Table

MetricCurrent LevelSentiment
Short % of Float4.2%Neutral/Safe (Not a target).
Days to Cover4.5Moderate (Minor squeeze potential).
TrendDecliningShorts are actually closing positions, not adding new ones.

Strategic Takeaway

Since the Short Interest is low (4%), you cannot rely on a “Short Squeeze” to save the stock. It has to rise on fundamental merit (Earnings).

  • Bull Case: The sellers are exhausted. With shorts not adding pressure, any good news will lift the stock easily.
  • Bear Case: There is no “guaranteed buyer” (short cover) waiting in the wings. If earnings are bad, the stock will drift lower naturally.

The date you need to circle on your calendar is Thursday, February 12, 2026.

While GoDaddy has not yet issued the official press release confirming the exact minute, historical patterns and analyst consensus point to this date.

The Event Details

  • Date: Thursday, Feb 12, 2026 (Estimated)
  • Time: After Market Close (approx. 4:05 PM ET)
  • The Report: Q4 2025 Earnings & Full Year 2026 Guidance

Why this specific date matters

This is the “Show Me” quarter. The stock has drifted down for three weeks because investors are nervous about the 2026 outlook. This report will resolve that anxiety one way or the other.

The “Pass/Fail” Metrics: The algorithms will react instantly to three specific numbers. You can write these down to grade the report yourself when it drops:

  1. Revenue Growth: Wall Street expects ~$1.27 Billion.
    • The Danger Zone: If they miss this number, it confirms the “AI is killing their business” narrative.
  2. Profit (EPS): Consensus is $1.58 per share.
    • The Bull Signal: GoDaddy has beaten earnings estimates in 3 of the last 4 quarters. If they post something like $1.65+, it proves their cost-cutting is working better than expected.
  3. The “Wild Card”: Buyback Authorization
    • With the stock near 52-week lows, watch for a sentence in the press release saying: “Board authorizes a new $1 Billion share repurchase program.” That single line would likely send the stock up 10% immediately.

Recommendation: Do not buy “Call Options” for this event unless you are willing to lose 100% of the premium. The “Implied Volatility” will be expensive. If you like the stock, the safer play is to simply hold the shares or sell “Put Options” at the $95 strike to buy it cheaper if it crashes.

GoDaddy Inc. – Investors for the latest financials.

_____________

Technical Analysis is about trading with the trend

Note: This technical analysis is for educational purposes. Please conduct your own analysis or consult a financial advisor before making investment decisions. The author of this article may hold long or short positions in the featured stocks or indexes. The article was written with the help of AI and was reviewed by an editor.

© 2026 TradeOnline.ca InvestOnline.ca ChartAnalysis.ca
As of 2026, standard asset allocation rules have shifted

Published January 16, 2026

As of 2026, standard asset allocation rules have shifted. Because people are living longer and inflation remains a long-term threat, the old “safe” rules are now considered risky because they often result in running out of money.

The traditional rule of “100 minus your age” (meaning a 30-year-old holds 70% stocks) is widely viewed by modern financial planners as too conservative. The new standard is closer to “110 or 120 minus your age.”

Here is the breakdown of asset allocation by age group for the current market environment.

The Master Allocation Table (2026 Standard)

This table assumes a “Moderate to Growth” mindset, which is the default for most Target Date Retirement Funds (like Vanguard or BlackRock).

Age GroupStocks (Equities)Bonds/Fixed IncomeCash/ReservesPrimary Goal
20s90% – 100%0% – 10%< 5%Aggressive Growth (Max compounding)
30s80% – 90%10% – 20%~5%Growth (Buying houses/kids, but stay invested)
40s70% – 80%20% – 30%5% – 10%Balanced Growth (Peak earning years)
50s60% – 70%30% – 40%10%Transition (Reducing volatility risk)
60s (Early)50% – 60%40% – 50%10% – 15%Preservation + Growth (Must beat inflation)
70s+30% – 40%50% – 60%10% – 20%Income & Distribution (Drawing down)

Detailed Breakdown by Decade

1. The Accumulators (Ages 20–35)

  • The Strategy: Maximum exposure to the stock market.
  • Why: You have the greatest asset of all: Time. If the market crashes 30% (like in 2020 or 2008), it is actually good for you because you are buying cheaper shares with your paycheck contributions.
  • Common Mistake: Holding too much cash. Many Gen Z investors currently hold 30%+ in cash because they fear a crash. This is a mathematical error known as “Cash Drag” that kills long-term wealth.
  • Allocation: 100% Equities (S&P 500 or Total World Stock ETFs).

2. The Builders (Ages 35–50)

  • The Strategy: High growth, but slight diversification.
  • Why: You likely have “real” liabilities now (Mortgage, RESPs for kids). You can’t afford a 100% loss, but you still need 20 years of growth before retirement.
  • Allocation: 80% Stocks / 20% Bonds.
    • Note: In 2026, with interest rates stabilized, bonds actually pay a decent yield again (unlike 2010–2021), so the 20% bond chunk finally generates income.

3. The Pre-Retirees (Ages 50–60)

  • The Strategy: The “Red Zone.”
  • Why: This is the most dangerous decade. If a massive crash happens 2 years before you retire (Sequence of Returns Risk), it can permanently delay your retirement. You must begin adding bonds to dampen the volatility.
  • Allocation: 60% Stocks / 40% Bonds.
  • The Shift: You stop asking “How much can I make?” and start asking “How much can I lose?”

4. The Retirees (Ages 60–75)

  • The Strategy: Income harvesting.
  • Why: You no longer have a paycheck. Your portfolio is the paycheck. You need safe assets (Bonds/Cash/GICs) to pay for groceries for 5–7 years so that if the stock market crashes, you don’t have to sell stocks at the bottom to eat.
  • The “Bucket” Strategy:
    • Bucket 1 (Cash/GIC): 2 years of living expenses.
    • Bucket 2 (Bonds): 5 years of living expenses.
    • Bucket 3 (Stocks): Everything else (for growth 10+ years out).

The “Rule of 120” (The Modern Formula)

If you want a quick math formula, use 120 – Age = Equity %.2

  • Example: You are 40 years old.
  • 120 – 40 = 80% Stocks. (The other 20% is bonds/cash).

Why 120 and not 100?

Because you are likely to live to 90. If you follow the old “100 minus age” rule, you would have 0% stocks at age 100. In reality, a 65-year-old retiree still needs their portfolio to grow for another 25–30 years to fight inflation.

The Dot-Com crash (2000–2002) was not a sudden “flash crash” like 1987 or 2020; it was a slow, painful “bleed” that lasted 2.5 years.

Published January 15, 2026

The magnitude of the drop depended entirely on which index you were holding.

1. The Epicenter: NASDAQ (Tech Stocks)

This is where the bubble actually was. The crash here was catastrophic.

  • The Drop: -78%
  • The Numbers: It fell from a peak of 5,048 (March 10, 2000) to a low of 1,114 (October 9, 2002).
  • The Recovery: It took 15 years (until 2015) for the NASDAQ to return to its year 2000 peak.

2. The Broader Market: S&P 500

Because the S&P 500 contained both tech stocks and regular companies (Banks, Oil, Retail), it fell less, but was still cut in half.

  • The Drop: -49%
  • The Timeline: It peaked in March 2000 and didn’t hit bottom until October 2002.

3. The “Safety” Trade: Dow Jones Industrial Average

The Dow held up the best because it was filled with “boring” old-economy companies (like Caterpillar, 3M, General Electric) that investors fled to for safety.

  • The Drop: -38%

The “Wealth Destruction” in Specific Stocks

To understand the pain, you have to look at the individual giants, not just the index. Many companies that survived still lost almost all their value:

  • Amazon: Dropped -94% (From $107 to $6).
  • Cisco: Dropped -86% (It was the most valuable company in the world in 2000; it still has not returned to its 2000 highs in inflation-adjusted terms).
  • MicroStrategy: Dropped -99% (From $3,330 to $4).

Why this matters for 2026: We are currently seeing a similar “split” market. The S&P 500 is highly concentrated in AI tech (NVIDIA, Microsoft), much like the NASDAQ was in 2000. If the “AI Bubble” were to burst, you would likely see a similar dynamic: a massive 70%+ drop in the pure-play AI stocks, while the broader “Old Economy” stocks (like the Canadian banks or Energy names we discussed) might only drop 30–40%.


The TSX (then called the TSE 300) suffered a massive drop of approximately 50%, essentially cutting the value of the entire Canadian stock market in half.

However, the “Canadian Crash” was unique because it was driven almost entirely by the collapse of one single company.

Here is the breakdown of the TSX drop compared to the U.S. markets.

1. The Numbers

  • The Peak: On September 5, 2000, the index hit an all-time high of 11,423.
    • Note: The TSX peaked 6 months later than the U.S. markets because our tech giant (Nortel) kept rallying even after the NASDAQ cracked in March.
  • The Bottom: By October 9, 2002, the index had crashed to 5,695.
  • The Total Drop: -50.1%

2. The Villain: The “Nortel Effect”

You cannot talk about the 2000 crash in Canada without talking about Nortel Networks.

  • The Concentration: At its peak in 2000, Nortel alone made up 33% to 35% of the entire TSE 300 index.2
  • The Implosion: Nortel stock fell from $124 to eventually pennies (and bankruptcy).
  • The Result: Because Nortel was 1/3rd of the index, its collapse mathematically dragged the index down 30% by itself.
  • The “Other” TSX: If you excluded Nortel, the rest of the Canadian market (Banks, Oil, Rail) actually performed reasonably well during that period, dropping far less than the headline number suggested.

3. Comparison to US Markets

The TSX performed “in the middle” of the U.S. indices.

IndexDrop (2000–2002)Primary Victim
NASDAQ-78%Pure Tech (Amazon, Cisco, Pets.com)
TSX (Canada)-50%Nortel (plus JDS Uniphase, BlackBerry)
S&P 500-49%Broad US Economy
Dow Jones-38%Old Economy (Caterpillar, 3M, GE)

Relevance for 2026

This history is critical for you right now because of the XEG ETF we discussed earlier.

  • Then: Nortel was 33% of the TSX.
  • Now: Canadian Natural Resources (CNQ) and Suncor (SU) are 50% of the XEG ETF.
  • The Lesson: When an index is that concentrated, a problem with one company becomes a crash for the entire fund. If CNQ were to have a major regulatory or operational disaster, XEG would suffer a “Nortel-like” drag, even if oil prices stayed high.

As of early 2026, the U.S. Dollar remains the overwhelming “King” of global trade, despite high-profile efforts by nations like China and Russia to use their own currencies.

Published January 15, 2026

Here is the breakdown of exactly how much of the world’s business is conducted in Dollars versus other currencies.

1. The “Invoicing” Number: ~50%

Approximately 50% of all global trade invoices are written in US Dollars.

  • The Disconnect: This is staggering because the United States itself only accounts for about 10–11% of global trade volumes.
  • The Reality: If Brazil sells coffee to Vietnam, or if Saudi Arabia sells oil to India, they almost always write the contract in US Dollars, not Reals, Dongs, or Rupees. This is known as “Vehicle Currency” status.
  • Total Value: With global trade estimated at roughly $35 Trillion in 2025, this means roughly $17.5 Trillion worth of goods annually are priced and sold in USD.

2. The “Payments” Number (SWIFT): ~59%

When it comes to actually transferring the money between banks (via the SWIFT messaging system), the Dollar’s dominance is even higher because it is the “middleman” currency for smaller nations.

  • USD Share: ~59% (Recent data shows it widening its lead).
  • Euro Share: ~13% (Has declined significantly; historically it was often >30%).
  • Chinese Yuan (RMB): ~5–6% (This has doubled in recent years but remains a distant third).

3. The “Reserves” Number: ~58%

This represents the “savings accounts” of Central Banks (like the Bank of Canada or People’s Bank of China).

  • USD: ~58% of all global official reserves.5
  • Euro: ~20%.6
  • The Shift: While the percentage of USD has slowly drifted down from ~70% (20 years ago) to ~58% today, the money hasn’t gone to other currencies—it has mostly gone into Gold.

Summary Table: The Dollar vs. The World

MetricUS Dollar ShareNext Competitor
Trade Invoicing~50%Euro (~20%)
Global Payments (SWIFT)~59%Euro (~13%)
Central Bank Reserves~58%Euro (~20%)
Oil Markets~90%+Yuan (growing in Russian/Iranian trade)

Why this matters for your Canadian business

Because 50% of trade is invoiced in USD, the CAD/USD exchange rate (currently ~$1.38) impacts your input costs even if you aren’t buying from America.

  • If you buy paper from a mill in Brazil or Indonesia, they likely set their price in USD.
  • When the Canadian Dollar weakens, all of your global imports get more expensive, not just the ones from the U.S.

As of early 2026, the United States debt-to-GDP ratio sits at approximately 125.4%

As of early 2026, the United States debt-to-GDP ratio sits at approximately 125.4%, meaning the national debt is now roughly 25% larger than the entire annual economic output of the country.

For the first time in history, the US government is now spending over $1 trillion annually just on interest payments—more than the entire budget for the Department of Defense.

Here is the breakdown of how the U.S. compares to other major economies and the details on the interest costs.

1. Debt-to-GDP Ratio Comparison (2025–2026 Estimates)

The U.S. has one of the highest debt ratios in the developed world, surpassed significantly only by Japan and arguably Italy.

CountryDebt-to-GDP RatioContext
Japan~235%The world leader in debt, but unique because most of it is held domestically by Japanese citizens/banks, making a crisis less likely.
Italy~138%Perennially high debt; a major concern for the Eurozone.
United States~125%High & Rising. The U.S. benefits from the dollar being the world reserve currency, allowing it to borrow cheaper than others.
France~116%Struggling with budget deficits similar to the U.S.
United Kingdom~103%Has risen sharply post-pandemic and energy crisis.
China~88%**Official government debt is lower, but if you include “Local Government Financing Vehicles” (shadow debt), estimates often exceed 110%.
Canada~69%Relatively healthy compared to G7 peers (Federal & Provincial combined).
Germany~63%The “fiscal hawk” of Europe; constitutionally limits new debt.

2. The Interest Payments: A New “Trillion Dollar” Line Item

The cost to service the U.S. debt has exploded due to the combination of a massive debt pile (~$36 Trillion+) and higher interest rates (averaging 4-5% on new Treasury bonds).1

  • Current Annual Cost: ~$1.05 Trillion (Annualized Rate as of late 2025).
  • The Milestone: In FY2025, interest payments officially exceeded the Defense Budget (~$850B) and Medicare spending for the first time.
  • Why it matters: This money buys nothing—no roads, no tanks, no healthcare. It is simply the cost of renting money.2 It crowds out other government priorities; every dollar spent on interest is a dollar that cannot be spent on tax cuts or new programs.3+1

3. Why isn’t the U.S. in a crisis like Greece?

You might wonder why a 125% ratio caused a collapse in Greece (2010) but not in the U.S.

  1. Reserve Currency: The world trades in Dollars. Foreign nations need U.S. debt (Treasury bonds) to facilitate trade, creating permanent demand for U.S. debt that other countries don’t have.
  2. Control of Currency: The U.S. borrows in its own currency (Dollars). It can technically never “run out” of money to pay debts, though printing money to pay debt leads to high inflation.
  3. Economic Engine: Despite the debt, the U.S. economy (GDP) grows faster than Europe or Japan, convincing investors it can handle the load—for now.

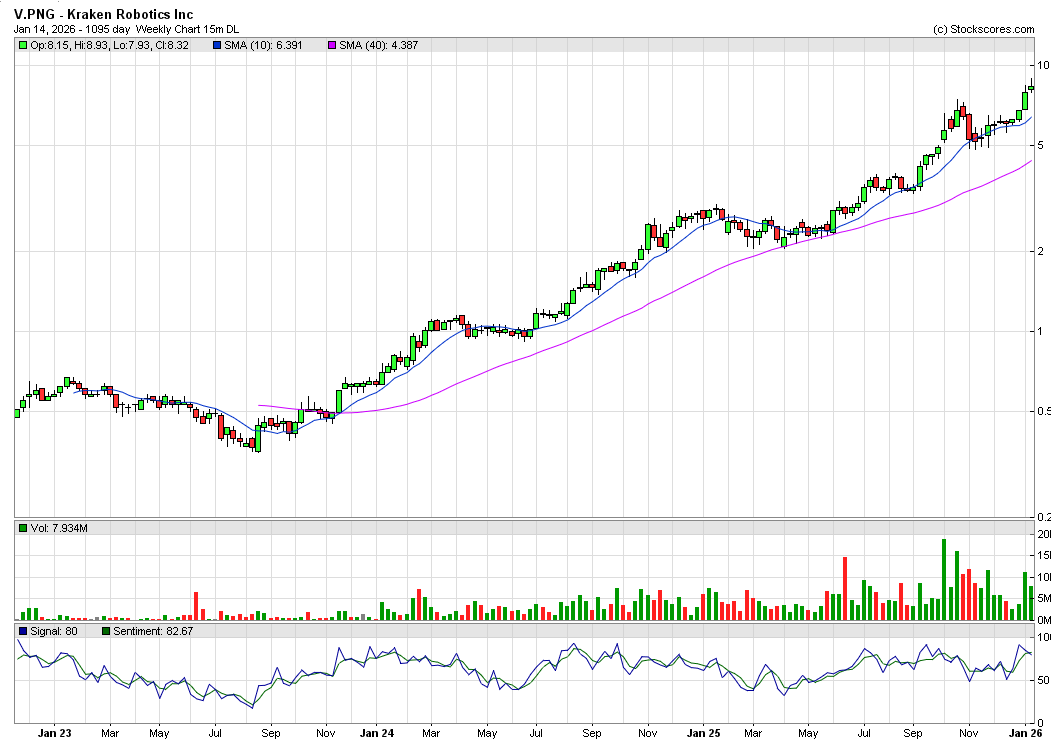
As of January 14, 2026, Kraken Robotics (TSX-V: PNG) is in the middle of a massive breakout moment.

Published January 14, 2026

For years, Kraken was known as a “niche sonar company.” In early 2026, it is rapidly re-rating as a critical defense supplier for autonomous underwater warfare.

Here is a 3-year chart:

Kraken Robotics 3-year chart

Here is the overview of the company’s current status, financials, and the major news from this week that is driving the stock.

1. The “Headline” News (January 2026)

The most important update for you is the announcement made just yesterday (Jan 13, 2026).

  • The Deal: Kraken secured $35 million in purchase orders for its SeaPower™ batteries.
  • Why it matters: This confirms that Kraken is no longer just selling “eyes” (Sonar) for underwater drones; it is now selling the “heart” (Power).
  • The Customer: While unnamed, industry analysts strongly link these batteries to major defense prime contractors (like Anduril and its “Ghost Shark” program) who need massive, pressure-tolerant batteries for long-endurance missions.

2. Financial Snapshot (The Growth Curve)

Kraken has shifted from “unprofitable R&D” to “profitable growth.”

  • Stock Price: Trading in the $5.25 – $6.10 CAD range (up significantly from the $1.00 range seen in 2024).
  • Market Cap: Now exceeding $1.1 Billion CAD, moving it out of “micro-cap” territory.
  • Revenue Run Rate:
    • Q3 2025 (Last reported): Revenue hit $31.3 million (up 60% year-over-year).
    • EBITDA: Adjusted EBITDA hit $8.0 million (up 92%).
    • 2026 Outlook: Analysts expect 2026 revenue to easily clear $150M+ as their new factory comes online.

3. The “Three-Pillar” Business Model

Kraken is unique because it owns the entire technology stack for subsea warfare and energy.

A. The “Eyes”: Synthetic Aperture Sonar (SAS)

  • Product: KATFISH™ Towed SAS System.
  • The Tech: Traditional sonar creates blurry images. Kraken’s SAS creates “photo-quality” images of the seabed using software processing.
  • Use Case: Minehunting (finding sea mines) and Pipeline Inspection.
  • Key Clients: NATO navies (Canada, USA, Denmark, Poland).

B. The “Heart”: SeaPower™ Batteries (The New Growth Engine)

  • The Tech: Most subsea batteries need heavy steel pressure vessels to survive deep water. Kraken’s batteries are pressure-tolerant (potted in polymer). They don’t need a heavy shell, so they are lighter and hold 2x the energy of competitors.
  • Catalyst: A new Battery Manufacturing Facility in Nova Scotia is opening this quarter (Q1 2026) to triple their production capacity.

C. The “Service”: Robotics as a Service (RaaS)

  • Instead of selling the robot ($2M), Kraken will bring their robot and crew to your site and charge you per day to map the ocean floor.
  • Acquisition: In 2025, they acquired 3D at Depth, adding “Subsea LiDAR” (lasers) to their service offering, allowing them to measure underwater infrastructure with millimeter accuracy for oil & gas clients.

4. Investment Risks

Despite the hype, there are two specific risks to watch in 2026:

  • Valuation: The stock is trading at a high multiple (Price-to-Sales > 10x). The market has “priced in” perfection for the new battery factory. Any delay in opening that factory could hurt the stock.
  • Geopolitics: Their growth is tied to Defense budgets. If the Ukraine/Russia or China/Taiwan tensions de-escalate significantly, the “urgency” for underwater drones may fade.

Summary

Kraken Robotics has successfully graduated from a “science project” to a Defense Industrial mid-cap.

  • 2024 Story: “They have cool sonar.”
  • 2026 Story: “They are the primary battery supplier for the Western world’s underwater drone fleet.”

As of January 2026, the landscape for “Inverse ETFs” in Canada has changed significantly due to the massive rebranding of Horizons ETFs to Global X

Published January 13, 2026

If you are looking for the famous “H-Series” tickers (like HXD, HIX, or HQD), many of them have been renamed and given new ticker symbols.

Here are the most popular Inverse Canadian ETFs, organized by sector and updated with their new 2026 tickers.

1. Betting Against the Canadian Market (TSX 60)

These are the standard tools for shorting the broad Canadian economy (Banks, Energy, Rail).

StrategyNew TickerOld TickerFund Name
-1x InverseCNDI(HIX)BetaPro S&P/TSX 60 Daily Inverse ETF
-2x BearCNDD(HXD)BetaPro S&P/TSX 60 -2x Daily Bear ETF
  • Use Case: You believe the general Canadian economy is entering a recession.
  • Note: CNDD provides double leverage (if TSX falls 1%, CNDD rises 2%).

2. Betting Against Canadian Energy

You have two distinct options here: betting against the Oil Companies (Stocks) or betting against the Price of Oil (Commodity).

StrategyNew TickerOld TickerFund Name
Short Oil STOCKSNRGD(HED)BetaPro S&P/TSX Capped Energy -2x Daily Bear
Short Oil PRICEHOD(Kept Ticker)BetaPro Crude Oil Inverse Leveraged Daily Bear
Short Nat GasHND(Kept Ticker)BetaPro Natural Gas Inverse Leveraged Daily Bear
  • Crucial Distinction:
    • Buy NRGD if you think Suncor/CNQ stocks will fall.
    • Buy HOD if you think the WTI Oil Price will fall. (HOD is extremely volatile and suffers from “decay” if held long-term).

3. Betting Against Canadian Banks

With the mortgage renewal cliff in 2026, this is a popular trade for those bearish on the housing market.

StrategyNew TickerOld TickerFund Name
-2x Bank BearCFOD(HFD)BetaPro S&P/TSX Capped Financials -2x Daily Bear

4. Betting Against US Tech (TSX Listed)

Many Canadians use their CAD accounts to short the US market without converting currency.

StrategyNew TickerOld TickerFund Name
Short S&P 500SPXD(HSD)BetaPro S&P 500 -2x Daily Bear ETF
Short NASDAQQQD(HQD)BetaPro NASDAQ-100 -2x Daily Bear ETF

⚠️ Critical Warning: The “Daily Reset” Trap

These ETFs are not long-term investments.1 They are designed for 1-day trades.

  • The Decay: Because they reset their leverage every single day, holding them for weeks or months will erode your value, even if the market goes in your direction.2
  • Example: If the market is flat but volatile (up 2% one day, down 2% the next), you will lose money in both the Bull (+2x) and Bear (-2x) funds over time.
  • Rule of Thumb: Do not hold these tickers (especially the -2x ones like CNDD or HOD) for longer than a few days unless you are actively managing the position.

Yes, CNDI (BetaPro S&P/TSX 60 Daily Inverse ETF) does decay.

Even though it is only -1x (Single Inverse) and not -2x like the riskier funds, it still suffers from “Volatility Drag” because of its daily reset mechanism.

If you hold CNDI for more than one day in a choppy market, you are mathematically guaranteed to lose value over time, even if the TSX 60 ends up flat.

The Math: How the “Daily Reset” Eats Your Money

To understand why it decays, look at this simple 2-day scenario where the market goes Up one day and Down the next, ending back where it started.

Scenario: The “Choppy” Market

Imagine the TSX 60 Index starts at $100.

  • Day 1: The Market goes UP 10%.
  • Day 2: The Market goes DOWN 9.09% (this brings it exactly back to $100).

Here is what happens to your CNDI shares:

DayMarket ActionCNDI Action (Inverse)Your CNDI Value
StartIndex at $100Buy at $100$100.00
Day 1Market +10% (to $110)CNDI -10%$90.00
Day 2Market -9.09% (back to $100)CNDI +9.09%$98.18
ResultMarket is FLAT ($0 change)You LOST ~$1.82-1.8% Loss

The Decay: The market did nothing (returned to zero), but you lost nearly 2% of your money. This is because losing 10% hurts you more than gaining 9% helps you. You are trying to recover from a smaller base ($90 instead of $100).

Why CNDI Decays Slower than CNDD (-2x)

While CNDI decays, it is much safer than the -2x leveraged version (CNDD). Decay essentially “squares” with leverage.

  • CNDI (-1x): Moderate Decay (Dangerous over months).
  • CNDD (-2x): Rapid Decay (Dangerous over weeks).

Summary Rule

  • Use CNDI for: A trade lasting 1 day to 2 weeks when you are confident the market will drop in a straight line.
  • Do NOT use CNDI for: A long-term “hedge” against a recession. If the market grinds sideways for 6 months before crashing, your CNDI shares will have already decayed significantly, and you won’t get the full protection you expected.

Better Hedge: If you need protection for 6+ months, it is often cheaper to buy Put Options on the TSX 60 (XIU) rather than holding an inverse ETF that bleeds value daily.

_____________

Technical Analysis is about trading with the trend

Note: This technical analysis is for educational purposes. Please conduct your own analysis or consult a financial advisor before making investment decisions. The author of this article may hold long or short positions in the featured stocks or indexes. The article was written with the help of AI and was reviewed by an editor.

© 2026 TradeOnline.ca InvestOnline.ca ChartAnalysis.ca
Contact[email protected]

Overview of the foreign takeover of Canada’s mining giants over the last 50 years

Published January 9, 2026

This history is often described by economists and nationalists as the “Hollowing Out of Corporate Canada.”

The Thesis: From “Builder” to “Branch”

Fifty years ago, Canada didn’t just dig rocks; it built the global companies that managed them. Toronto and Vancouver were the command centers of the global mining industry. Today, while the mines are still here (they can’t move), the decisions are largely made in Switzerland (Glencore), Brazil (Vale), London (Rio Tinto), and Australia (BHP).


Era 1: The Golden Age of Canadian Giants (1970s – 2005)

In this era, Canadian companies were the predators, not the prey. They aggressively acquired assets globally.

  • The Big Four: The industry was dominated by four massive, Canadian-headquartered titans:
    1. Inco (International Nickel Company): Based in Toronto, it controlled the global nickel market from Sudbury, Ontario.
    2. Falconbridge: Another nickel/copper giant, Inco’s fierce rival, also based in Toronto.
    3. Noranda: A massive diversified miner and smelter (Quebec roots) that was a crown jewel of Canadian industry.
    4. Alcan (Aluminum Company of Canada): Based in Montreal, it was the second-largest aluminum producer in the world.
  • The Status Quo: These companies developed world-leading technology (like Inco’s flash smelting) and their CEOs were powerful figures in Canadian public policy.

Era 2: The “Great Exodus” (2005 – 2007)

In a span of just 24 months, Canada lost almost its entire top tier of mining companies to foreign buyouts. This period effectively ended Canada’s reign as a global mining manager.

  • 2006: The Loss of Falconbridge & Noranda
    • The Deal: After a complicated bidding war, Xstrata (a Swiss-Anglo giant) acquired Falconbridge (which had just merged with Noranda) for $18 billion.
    • The Result: One of Canada’s oldest mining names disappeared into a Swiss conglomerate (which later merged with Glencore).
  • 2006: The Loss of Inco
    • The Deal: In a shock to national pride, Inco was acquired by Vale (CVRD) of Brazil for $19 billion.
    • The Context: Inco had tried to merge with Falconbridge to create a “Canadian Super-Miner” to fight off foreign takeovers, but the deal failed. Vale swooped in, and the “Sudbury Basin” effectively became a Brazilian outpost.
  • 2007: The Loss of Alcan
    • The Deal: Rio Tinto (UK/Australia) bought Alcan for $38 billion.
    • The Result: It was renamed “Rio Tinto Alcan.” While the HQ technically stayed in Montreal for the aluminum division, the strategic power shifted to London.

Why did this happen?

The Canadian government (under Stephen Harper) approved these deals under the Investment Canada Act, declaring they were a “net benefit” to Canada. Critics argued it stripped Canada of its head offices, R&D departments, and high-paying legal/financial service jobs.


Era 3: The “Critical Minerals” Pivot & The Last Stand (2008 – 2024)

After the 2006 exodus, the government realized it had made a mistake. The narrative shifted from “free market” to “strategic protectionism,” especially regarding Potash and Critical Minerals.

  • 2010: The BHP-PotashCorp Block
    • A pivotal moment. BHP Billiton (Australia) tried to buy PotashCorp (Saskatchewan) for $40 billion.
    • The Twist: The federal government blocked the deal—the first time it had ever used the “Net Benefit” test to stop a major takeover. They realized losing the world’s largest fertilizer company was a bridge too far. (PotashCorp eventually merged with Agrium to form Nutrien, keeping it Canadian).
  • 2023-2024: The Teck Resources Saga
    • Teck Resources was the “Last Mohican”—the last major diversified miner left in Canada.
    • The Glencore Raid: In 2023, Glencore launched a hostile takeover bid for the entire company.
    • The Defense: The Canadian government and the Keevil family (who controlled Teck’s voting shares) pushed back, citing “Critical Minerals” security.
    • The Compromise (The Split): Teck agreed to sell only its coal assets (Elk Valley) to Glencore (completed mid-2024), keeping the “green metals” (Copper/Zinc) as a standalone Canadian company… until late 2025.

Era 4: The “Merger of Equals” Era (2025 – Present)

The definition of “Takeover” has changed. Foreign companies now propose “Mergers” to avoid the political heat of a “Takeover.”

  • Late 2025: The Anglo-Teck Merger
    • In September 2025, Teck Resources and Anglo American announced a $70B merger.
    • The Spin: They call it a “merger of equals” with a headquarters in Canada, but Anglo shareholders own ~62% of the company. It effectively marks the end of Teck as a purely independent Canadian entity, though it survives in name.
  • 2025-2026: The New Reality
    • Today, “Canadian Mining” is largely composed of Mid-Tier companies (like Agnico Eagle, First Quantum, Lundin). The “Global Majors” are almost entirely foreign-owned.

Summary Table

CompanyAcquired ByCountry of BuyerYearPrice
Noranda / FalconbridgeXstrata (now Glencore)Switzerland/UK2006~$18B
IncoValeBrazil2006~$19B
AlcanRio TintoUK/Australia2007~$38B
Teck (Coal Division)GlencoreSwitzerland2024~$9B
Teck (Metals Division)Anglo American (Merger)UK2025~$70B (Deal value)

Key Takeaway:

The last 50 years was a transition from “Owners” to “Operators.” Canada is still a mining superpower in terms of geology and production, but it is no longer a superpower in terms of capital and control.

As of January 9, 2026, Glencore (LSE: GLEN) is the subject of the biggest story in the global mining world right now.

Published January 9, 2026

Just hours ago, news broke that Glencore and Rio Tinto are in preliminary merger talks. If this deal happens, it would create the largest mining company in history, valued at over $200 billion.

Here is the breakdown of Glencore’s situation and its massive footprint in Canada.

1. The Headline: The “Mega-Merger” Talks

  • The News (Jan 9, 2026): Glencore shares jumped roughly 10% today following reports that rival Rio Tinto is considering a bid to acquire the company.
  • The Logic:
    • Rio Tinto wants copper for the energy transition (EVs, Data Centers), and Glencore is one of the world’s largest copper producers.
    • The Problem: Rio Tinto exited the coal business years ago to be “green.” Glencore is the world’s biggest thermal coal shipper.
  • The Timeline: Under UK takeover rules, Rio Tinto has until February 5, 2026, to make a formal offer or walk away.

2. The Canadian “Coal Giant” (Elk Valley)

For your Canadian context, Glencore is now a dominant player in British Columbia.

  • The Acquisition: In mid-2024, Glencore completed the purchase of Teck Resources’ steelmaking coal business (Elk Valley Resources) for roughly $9 billion USD.
  • Current Status: Glencore now owns the massive Fording River, Elkview, and Greenhills mines in BC.
    • Why it matters: This is “Metallurgical Coal” (used to make steel), not “Thermal Coal” (burned for power). It is highly profitable and was a key reason Glencore wanted the assets.
  • The Spin-Off Question: Originally, Glencore planned to spin this coal business off into a separate company on the NYSE. That plan is currently in limbo. With the Rio Tinto talks happening, they may keep it or sell it to satisfy Rio’s ESG concerns.

3. Commodity Mix & Production

  • Copper (The Crown Jewel): This is the main attraction for investors. Glencore aims to produce 1.6 million tonnes of copper annually by 2035. However, production in late 2025 was softer than expected due to mine sequencing issues.
  • Cobalt: They remain the world’s largest producer of cobalt (essential for EV batteries), primarily from the Democratic Republic of Congo (DRC).
  • Zinc & Nickel: They are a top-tier global supplier, giving them immense leverage in the “Battery Metals” supply chain.

4. The “Old” Glencore Baggage

  • Legal/ESG: While the company settled its massive bribery investigations in 2022 (paying ~$1.5B in fines), individual accountability is still ongoing. In November 2025, several former executives entered “Not Guilty” pleas in a UK court regarding corruption charges. A trial is set for late 2027.
  • Reputation: This “legacy” issue is one of the reasons Glencore trades at a discount compared to BHP or Rio Tinto, making it an attractive takeover target.

Summary for Your Business

  • If the Merger Happens: Expect massive rebranding and contract reviews. Rio Tinto has stricter supplier standards than Glencore. If you service the old Teck mines in BC, a Rio takeover could change your procurement contacts.
  • If it Doesn’t: Glencore remains a cash-rich giant that is aggressively paying down debt and generating huge cash flow from its new Canadian coal mines.

Based on the most recent financial data available for the 2024–2025 fiscal year, here is the summary of the world’s largest metal producers by revenue.

The rankings are heavily skewed by business model. You have to separate the “Traders” (who sell other people’s metal) from the “Miners” (who dig it out of the ground) and the “Steelmakers” (who refine it).

1. The “Hybrid” Giant (Trading + Mining)

Glencore sits in a category of its own because its revenue includes its massive “Marketing” division (buying and selling commodities produced by third parties).

RankCompanyCountryRevenue (USD)Primary Metals
#1Glencore🇨🇭 Swiss / 🇬🇧 UK~$231 BillionCopper, Coal, Zinc, Cobalt
  • Context: While Glencore has huge revenue, its profit margins are much thinner than the pure miners because trading is a high-volume, low-margin game.

2. The “Pure” Mining Giants

These companies have lower revenue than Glencore but often higher profits because they own the assets (mines) and sell what they dig.

RankCompanyCountryRevenue (USD)Primary Metals
#1BHP Group🇦🇺 Australia~$55.7 BillionIron Ore, Copper, Coal
#2Rio Tinto🇬🇧 UK / 🇦🇺 Australia~$53.7 BillionIron Ore, Aluminum, Copper
#3Vale S.A.🇧🇷 Brazil~$38.1 BillionIron Ore, Nickel
#4Freeport-McMoRan🇺🇸 USA~$26.0 BillionCopper, Gold
  • Merger Impact: If Rio Tinto ($53.7B) buys Glencore ($231B), the combined entity would have revenues exceeding $280 Billion, dwarfing every other competitor in the sector.

3. The State-Owned Powerhouses (China)

Western lists often ignore these, but they are technically the largest metal producers by volume and revenue.

RankCompanyCountryRevenue (USD)Primary Metals
#1China Minmetals🇨🇳 China~$115 BillionDiversified (Copper, Zinc, Lead)
#2Jiangxi Copper🇨🇳 China~$72 BillionCopper
#3Zijin Mining🇨🇳 China~$41 BillionCopper, Gold, Lithium

4. The Steel Giants

Steelmakers generate massive revenue due to the high value of the finished product, even if their margins are tight.

RankCompanyCountryRevenue (USD)Primary Metals
#1China Baowu Group🇨🇳 China~$160 BillionSteel
#2ArcelorMittal🇱🇺 Luxembourg~$62.4 BillionSteel
#3Nippon Steel🇯🇵 Japan~$61.2 BillionSteel
#4POSCO Holdings🇰🇷 South Korea~$51.4 BillionSteel, Battery Materials

Summary Trend for Your Business

  • The “Big Three” Iron Ore Players (BHP, Rio, Vale): They are cash cows, but their revenues are essentially flat or slightly down due to weaker Chinese construction demand.
  • The “Green Metal” Players (Glencore, Jiangxi, Freeport): These are the ones seeing revenue volatility (and growth potential) tied to the Copper boom for data centers and EVs.

If the Glencore-Rio Tinto merger proceeds, the combined entity would be a behemoth in the Canadian resource sector, but surprisingly, their assets do not overlap much. Instead, they fit together like puzzle pieces, creating massive regional dominance.

Here is the breakdown of what a “Rio-Glencore” map of Canada would look like, by province.

1. Quebec: The Industrial Fortress

This is where the merger would be most powerful. A combined company would effectively control the entire base metal processing capacity of the province.

  • Rio Tinto’s Assets (Aluminum & Titanium):
    • Alcan Operations: Owns the massive aluminum smelters in the Saguenay–Lac-Saint-Jean region (Alma, Arvida, Grande-Baie, Laterrière).
    • Sorel-Tracy: Owns Rio Tinto Fer et Titane, which mines titanium and iron ore at Havre-Saint-Pierre and processes it in Sorel-Tracy.
  • Glencore’s Assets (Copper & Zinc):
    • Rouyn-Noranda: Owns the Horne Smelter, the only copper smelter in Canada (critical for recycling electronics).
    • Montreal (East): Owns the CCR Refinery, which processes the copper from the Horne Smelter.
    • Valleyfield: Owns CEZinc, the second-largest zinc refinery in North America.
    • Raglan Mine: Massive nickel mine in Nunavik (far north Quebec).
  • The Impact: If you print for industrial safety, training, or logistics in Quebec, this single company would control the Aluminum, Copper, Zinc, Titanium, and Nickel supply chains. They would be the province’s largest industrial employer by far.

2. British Columbia: The “Green vs. Black” Conflict

This is where the merger gets messy politically.

  • Rio Tinto (The “Green” Giant):
    • Kitimat: Owns the massive “BC Works” aluminum smelter, powered by its own hydroelectric dam (Kemano). It markets this as “low carbon aluminum.”
  • Glencore (The “Black” Giant):
    • Elk Valley: As of 2024, owns the massive steelmaking coal mines (formerly Teck Resources) in the southeast Rockies (Fording River, Elkview, Greenhills).
  • The Conflict: Rio Tinto spent years exiting coal to polish its ESG image. Buying Glencore brings them right back into the coal business in BC. Analysts speculate Rio might spin these coal mines off again to keep their “green” investors happy.

3. Ontario: The Sudbury/Timmins Split

  • Glencore’s Turf:
    • Sudbury: Owns “Sudbury INO” (Integrated Nickel Operations) – a major nickel/copper miner and smelter.
    • Timmins: Owns the Kidd Creek mine (Copper/Zinc). Note: This mine is nearing the end of its life (scheduled closure ~2026/2027), so it’s less of a long-term factor.
  • Rio Tinto’s Turf:
    • Rio has effectively no presence in Ontario mining. That is Vale (Brazilian) territory.
  • The Impact: This is good for regulators. Since there is no overlap in Sudbury, the Competition Bureau likely won’t block the deal on Ontario grounds.

4. Newfoundland & Labrador: The Iron King

  • Rio Tinto:
    • Owns the majority stake (~59%) in the Iron Ore Company of Canada (IOC).
    • Assets: Massive mines in Labrador City and the railway/port in Sept-Îles, Quebec.
  • Glencore:
    • Has no major operational footprint here, though they trade iron ore globally.

Summary for Your Business (The “Client List” Shift)

If this merger happens, the “Procurement Department” for half of Canada’s mining industry consolidates.

  • The Opportunity: If you are already a vendor for Rio Tinto, you essentially get a “hunting license” to pitch your services to the Glencore sites (Sudbury Nickel, Quebec Copper) that might adopt Rio’s standards.
  • The Risk: If you are a vendor for Glencore, get ready for a paperwork headache. Rio Tinto is known for having more rigid, bureaucratic supplier compliance standards than Glencore.

———-

Price of West Texas Intermediate (WTI) from 1968

Published January 2, 2026

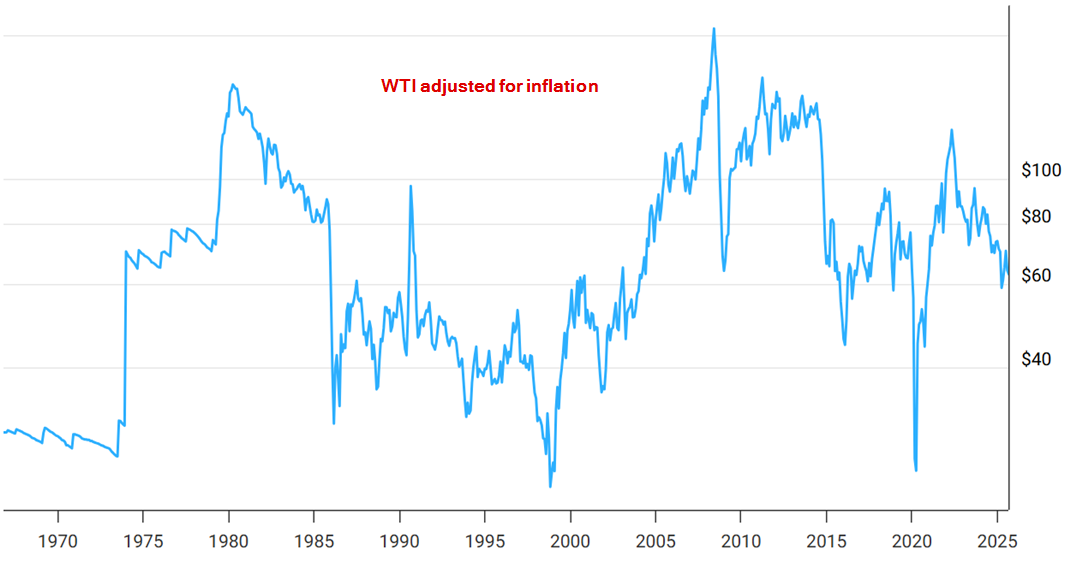
As of January 2, 2026, the price of WTI Crude Oil is approximately $57.50 USD per barrel. The price of oil shown in the chart is adjusted for inflation using the headline CPI and is shown by default on a logarithmic scale.

WTI chart adjusted for inflation

1. The Era of Cheap Oil (1968–1972)

Before the formation of OPEC as a political force, oil prices were remarkably stable and controlled largely by the “Seven Sisters” (major US/European oil companies).

  • 1968 Price: ~$3.00
  • Context: Oil was abundant and cheap. The US was the world’s swing producer, and prices rarely moved more than a few cents.

2. The Oil Shocks (1973–1985)

Everything changed in the 1970s when control of pricing shifted from Western companies to Middle Eastern nations.

  • 1973 (The First Shock): Prices tripled from $4 to $12 following the Arab Oil Embargo (Yom Kippur War).
  • 1979 (The Second Shock): Prices doubled from $15 to $39.50 following the Iranian Revolution.
  • 1980 Peak: Reached an inflation-adjusted high that wouldn’t be beaten until 2008.

3. The Great Collapse & The “Lost Decade” (1986–1999)

A massive oversupply (the “Glut”) caused prices to crash, leading to a long era of cheap energy.1

  • 1986 Crash: Saudi Arabia tired of cutting production and flooded the market.2 Prices collapsed from $30 to $10 in roughly four months.
  • 1990 Spike: Briefly hit $40 during the Gulf War (Iraq/Kuwait) but quickly fell back.3
  • 1998 Low: The Asian Financial Crisis crushed demand, sending oil down to $11.90 per barrel.

4. The “Supercycle” (2000–2014)

Driven by the industrialization of China and India, demand exploded.4

  • 2000-2007: steady climb from $25 to $90.
  • 2008 Peak: WTI hit its all-time record of $147.27 in July 2008.
  • 2008 Crash: The Global Financial Crisis sent it crashing down to $33 by December.
  • 2011–2014: The “Hundred Dollar Era.” Prices stabilized over $100 for nearly three years due to the Arab Spring.

5. The Shale Revolution & COVID (2015–2021)

US Fracking technology flooded the market with new supply, breaking OPEC’s grip.

  • 2014 Crash: Prices fell from $107 to $50 as OPEC refused to cut production to fight US shale.5
  • 2020 (The Anomaly): During the pandemic lockdowns, demand vanished. On April 20, 2020, WTI futures briefly traded at negative -$37.63 (traders paid people to take the oil).

6. The War & The Correction (2022–2026)

  • 2022 High: Russia’s invasion of Ukraine sent prices back to $123.
  • 2023–2024: Prices slowly ground lower as interest rates rose and US production hit record highs.
  • Late 2025/Early 2026: Prices have softened significantly to the $57–$60 range due to fears of oversupply and weak demand from China.6

Summary Table (Approx. Annual Averages)

YearPrice (Nominal)Key Event
1968$3.07Pre-OPEC stability
1974$9.35Post-Embargo
1980$37.42Iranian Revolution peak
1986$15.10The Price Collapse
1998$14.42Asian Financial Crisis
2008$99.67The Supercycle Peak (Hit $147 intraday)
2016$43.29Shale Oil Flood
2022$94.53Ukraine War
2026$57.50Current (Jan 3)

https://www.macrotrends.net/1369/crude-oil-price-history-chart

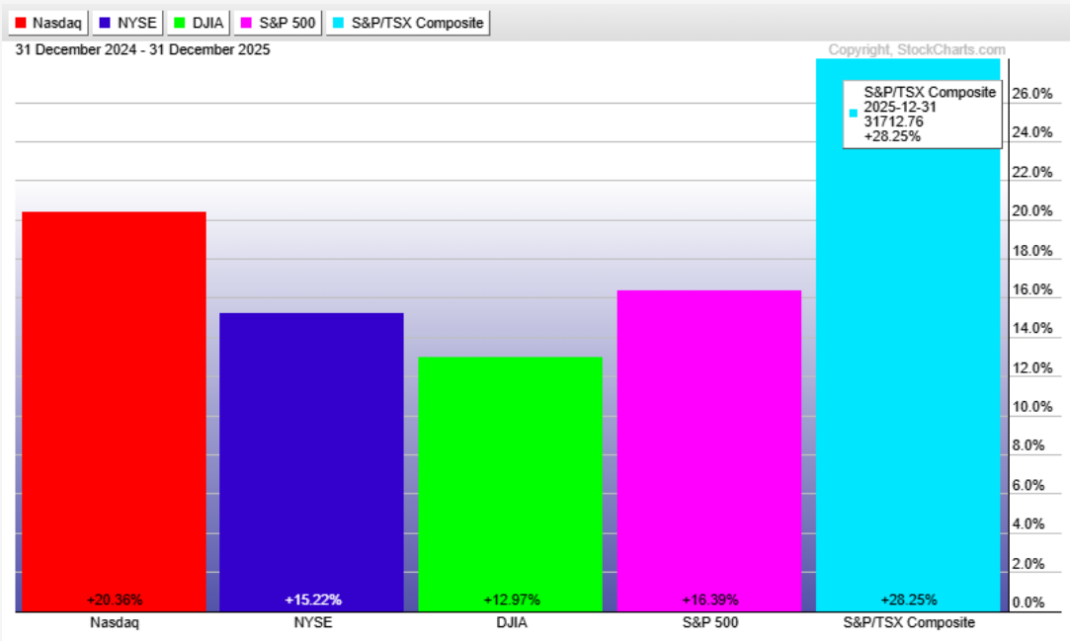
Performance of the major North American indexes in 2025

Published December 31, 2025

2025 was a historic, record-breaking year for the Canadian stock market. The S&P/TSX Composite Index ended the year with a gain of 28.25%, marking its best annual performance since 2009.

Performance of the TSX index in 2025

_____________

Technical Analysis is about trading with the trend

Note: This technical analysis is for educational purposes. Please conduct your own analysis or consult a financial advisor before making investment decisions. The author of this article may hold long or short positions in the featured stocks or indexes.

© 2025 TradeOnline.ca InvestOnline.ca ChartAnalysis.ca
Contact[email protected]