It is all about time and the annualized rate of return. The most important concept in investing.
https://www.thecalculatorsite.com/finance/calculators/compoundinterestcalculator.php
It is all about time and the annualized rate of return. The most important concept in investing.
https://www.thecalculatorsite.com/finance/calculators/compoundinterestcalculator.php
Published March 14, 2026
Analysis: This was published in WSJ today. It is worth the read.
While traditional energy investors spent the past weekend counting down the minutes until futures markets reopened on Sunday, overseas crypto traders were already placing their bets on the direction of oil prices.
Published March 8, 2026
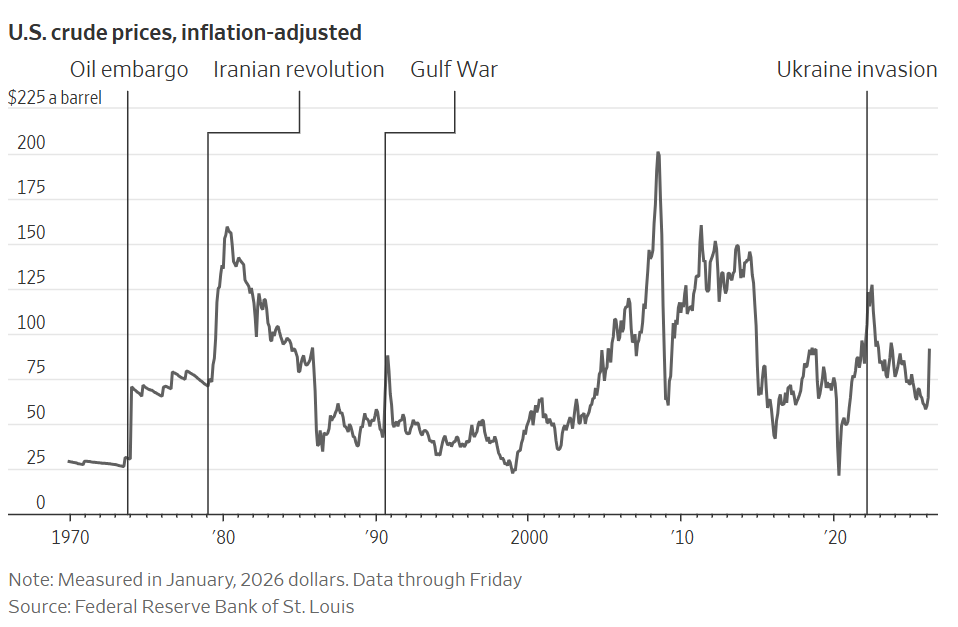
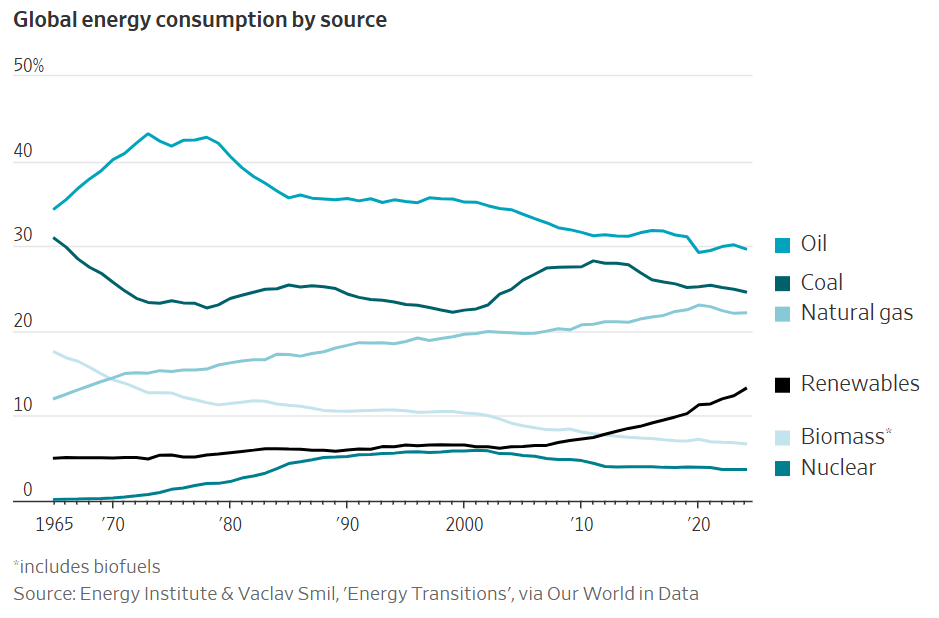
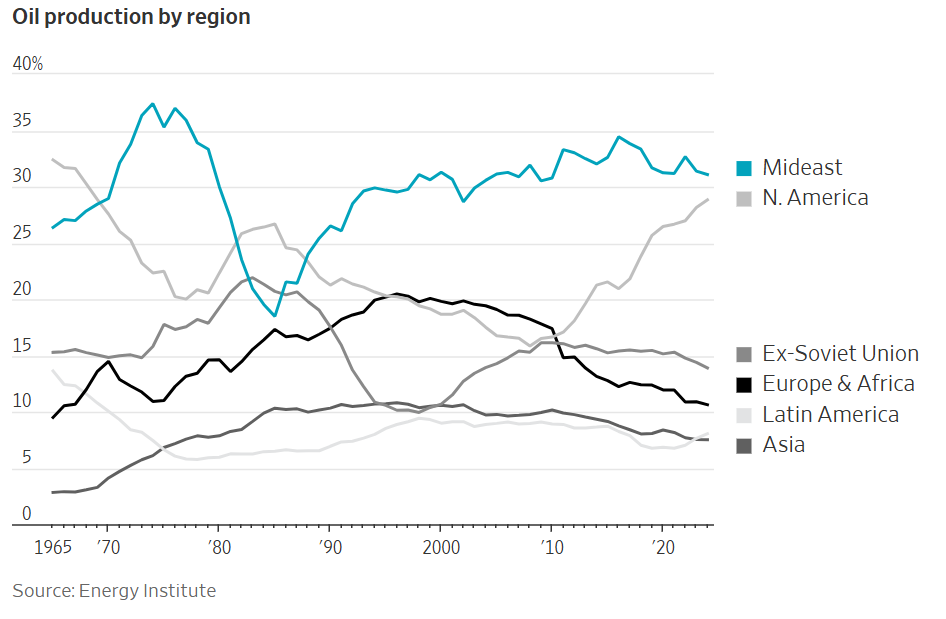
Oil surges above $110 a barrel
Published March 3, 2026
Here is a 6-month silver chart:
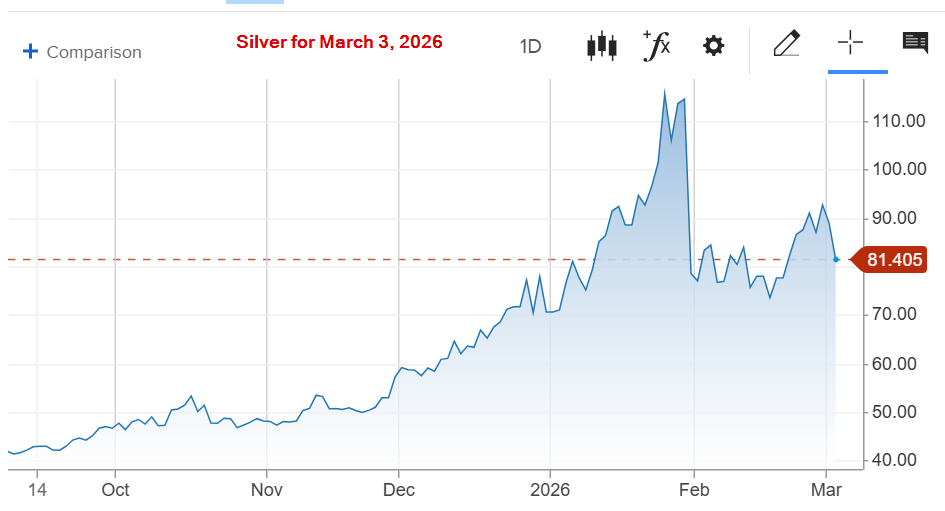
Silver is seeing a significant sell-off this morning, Tuesday, March 3, 2026, primarily because the initial “geopolitical shock” that drove prices to record highs over the weekend is beginning to fade, leading to aggressive profit-taking.
While gold is holding up better as a pure safe-haven, silver (the “restless cousin”) is down sharply—dropping as much as 7-8% in early trading to move back toward the $82–$84/oz range.
Here are the three specific factors driving the move:
While silver often benefits from geopolitical tension (like the current conflict involving the US, Israel, and Iran), the US Dollar Index (DXY) has surged to a 5-week high (near 98.5). In times of extreme uncertainty, global capital often flows into the dollar and US Treasuries rather than metals. Since silver is priced in dollars, a stronger greenback makes it more expensive for international buyers, creating immediate downward pressure.
Stronger-than-expected US manufacturing and inflation data (ISM Prices Paid hitting a 3.5-year high) have changed the math for interest rates.
Silver had an “explosive surge” reaching near $95–$96/oz on Sunday/Monday.
| Metric | Status (Mar 3, 2026) |
| Current Spot Price | ~$84.20/oz |
| Daily Change | -7.2% to -8.5% |
| Key Support | $82.00 / $81.50 |
| Main Catalyst | Strengthening USD + Delayed Fed Rate Cuts |
_____________
Note: This technical analysis is for educational purposes. Please conduct your own analysis or consult a financial advisor before making investment decisions. The author of this article may hold long or short positions in the featured stocks or indexes. The article was written with the help of AI and was reviewed by an editor.
© 2026 TradeOnline.ca InvestOnline.ca ChartAnalysis.ca
Published March 1, 2026
Based on data from the OPEC Annual Statistical Bulletin 2025 and the Energy Institute Statistical Review.
| Rank | Country | Reserves (Billion Barrels) | World Share (%) |
| 1 | Venezuela | 303.2 | 17.2% |
| 2 | Saudi Arabia | 267.2 | 15.1% |
| 3 | Iran | 208.6 | 11.8% |
| 4 | Canada | 163.1 | 9.2% |
| 5 | Iraq | 145.0 | 8.2% |
| 6 | United Arab Emirates | 113.0 | 6.4% |
| 7 | Kuwait | 101.5 | 5.8% |
| 8 | Russia | 80.0 | 4.5% |
| 9 | Libya | 48.4 | 2.7% |
| 10 | United States | 45.0 | 2.5% |
Keep an eye on Guyana, which has seen a meteoric rise in proven reserves (now over 11 billion barrels) following massive offshore discoveries. It is currently one of the fastest-growing oil provinces in the world.
Note: “Proven reserves” are those that can be recovered with “reasonable certainty” under current economic and operating conditions. These numbers change as new technology makes extraction cheaper or as new fields are discovered.
Canada’s oil reserves can be ranked by type and location. Here’s a breakdown of the major categories, along with their approximate reserves:
| Rank | Category | Location | Estimated Reserves |
|---|---|---|---|
| 1 | Oil Sands | Alberta | Approx. 167 billion barrels (over 97% of Canada’s total reserves) |
| 2 | Conventional Oil | Saskatchewan | Approx. 7 billion barrels |
| 3 | Conventional Oil | Newfoundland and Labrador | Approx. 1.6 billion barrels |
| 4 | Tight Oil (Shale Oil) | Alberta and Saskatchewan | Approx. 1 billion barrels (estimates vary) |
Note: Published with the assistance of AI and reviewed by an editor
While “10%” is the common shorthand answer, the truth depends entirely on your timeframe and whether you count dividends.
As of February 25, 2026, the S&P 500 has just come off a historic “triple-peat,” finishing 2025 up 17.9%, following gains of 25% in 2024 and 26.3% in 2023.
| Timeframe | Average Annual Return | Inflation-Adjusted (Real) |
| Last 10 Years (2016–2026) | ~12.2% | ~8.5% |
| Last 30 Years (1996–2026) | ~10.1% | ~7.2% |
| Since 1957 Inception | ~10.2% | ~6.5% |
| Since 1926 (Historical Data) | ~9.8% | ~6.2% |
1. The “Dividend Engine”
Price appreciation is only half the story. Dividends have historically accounted for roughly 31% to 34% of the S&P 500’s total return.
2. The “Average” Year is Rare
The stock market almost never actually returns exactly 10% in a single year. Since 1871, the annual return has landed between 8% and 12% in less than 10% of years. The market usually “overshoots” (up 20%+) or “undershoots” (down 10%+).
3. The 20-Year “Safety Net”
If you have a short-term horizon, your odds of a positive return are basically a coin toss (59% monthly). However, looking at every rolling 20-year period since 1928, the S&P 500 has produced a positive total return 100% of the time.
With the S&P 500 currently trading near record highs (approx. 6,915), many analysts are predicting a “valuation reset.” Goldman Sachs forecasts a 12% total return for the full year of 2026, driven more by earnings growth from AI adoption than by the “multiple expansion” (stocks getting more expensive) we saw in 2024.
Based on a 7% conservative “real” return (which accounts for inflation), here is how a $10,000 investment would grow over the next decade:
If you invested just $200 a month on top of that initial $10,000, your 10-year total would jump to **$53,308.83**.
Here is a compound interest calculator:
https://www.thecalculatorsite.com/finance/calculators/compoundinterestcalculator.php
Published in The Globe and Mail on February 24, 2026
Thomson Reuters Corp. TRI-T is betting on the value to professionals of artificial intelligence agents that can carry out complex tasks accurately and on their own, seeking to tamp down fears of disruption that have hung over the software sector in recent weeks.
As AI-based products flood the market, Toronto-based Thomson Reuters is seeking to draw a contrast. On one side is its own software, trained using a vast trove of content spanning the legal, tax and corporate sectors. And on the other, new plug-in tools brought to market by AI giants, which are directly challenging incumbents.
To highlight the difference, Thomson Reuters is making the case that its AI-based software is already taking hold at law firms as well as tax practices, as lawyers and accounting professionals seek to speed up their work and automate laborious tasks.
The company announced Tuesday that its AI-enabled CoCounsel technology now has one million users in more than 100 countries and territories.
Chief product officer David Wong predicts a turning point this year for businesses’ relationship with AI. He expects professional companies will focus more on the return they’re getting from AI investments.
“We are actually in a bit of an ROI crisis,” Mr. Wong told reporters. “Businesses have been experimenting with AI. They bought licences. They’ve run pilots. They’ve told their boards, ‘we’re investing in AI transformation.’ But they’re struggling to show results.”
Slumping tech stocks revive concerns about AI-fuelled disruption
Software and data providers such as Thomson Reuters have watched their share prices plunge lately, not for that reason, but in response to new tools for lawyers released by Anthropic, a leading AI company that makes the Claude large language models.
For some investors, that raised the risk that established software companies could be disrupted, and muddied the outlook about who will win or lose in the race to deploy AI for professionals.
In response, Thomson Reuters chief executive officer Steve Hasker said the market reaction “represents anxiety and not fundamentals.”
Woodbridge Co. Ltd., the Thomson family holding company and controlling shareholder of Thomson Reuters, also owns The Globe and Mail.
Although some investors interpreted Anthropic’s new tools as a direct threat to software providers, Thomson Reuters chief technology officer Joel Hron said the company has “developed a particularly deep collaboration” with Anthropic, which includes collaboration on engineering and research.
Thomson Reuters worked closely with Anthropic for the past year, using Claude as a foundation to develop the newest version of CoCounsel, which is billed as an autonomous legal assistant that can do its own research and deliver human-calibre output. A lawyer then reviews and validates what the agent drafts.
“This is not a black box,” Mr. Hron said. “It is meant to be a human collaborator.”
One Thomson Reuters tax product features an AI agent that helps prepare multiple tax returns for companies collecting sales tax in many jurisdictions, then flags items that need human review. The product’s first version cut the total amount of time spent on the process, which is typically very manual, by 60 to 70 per cent, Mr. Wong said.
Thomson Reuters has also been privately working on a project to develop a proprietary model, trained on a more concentrated set of data that draws on Thomson Reuters’s expertise in professional services. The company has worked closely with academics on the project.
Early benchmarking tests highlighted by Thomson Reuters suggest that its own model outperformed prominent rivals such as OpenAI’s GPT-5 and Anthropic’s Claude Opus 4.5 on tests of reasoning and factuality, document review, summarization and AI-assisted research.
Some products present well in demonstrations but stumble when it comes to accuracy and verification, said Prof. Jonathan Richard Schwarz, head of AI research at Thomson Reuters and a visiting professor at Imperial College London.
On “correctness” and an emphasis on evidence, “the models are really struggling,” he said. “Rather than throwing more hardware and more compute at the same sort of approach, really you should try and bring in this domain expertise into the training process.”
Thomson Reuters leans on proprietary data in AI race as disruption fears mount – The Globe and Mail
Published February 20, 2026
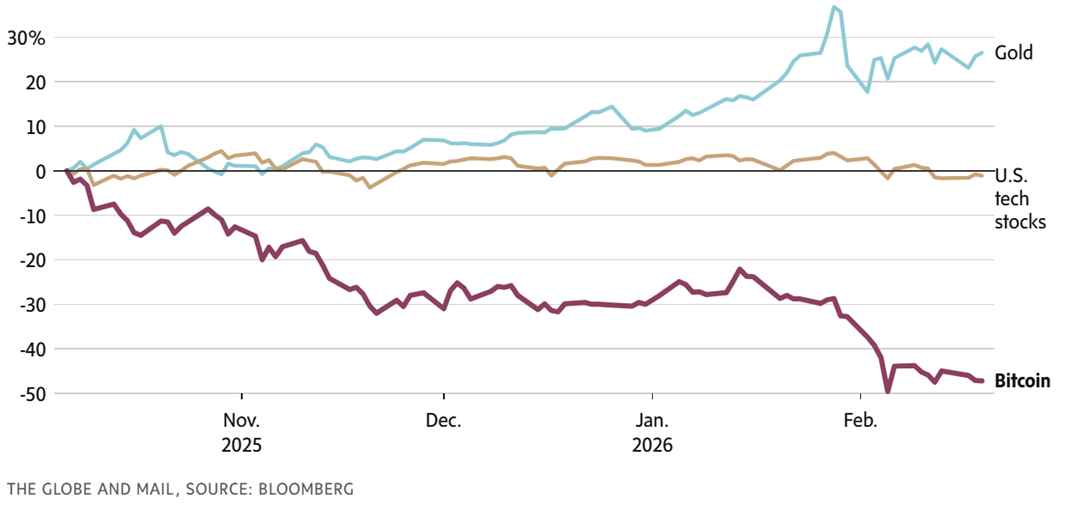
Bitcoin zero? Crypto evangelists have run out of stories to tell – The Globe and Mail
Published February 7, 2026
The following article was published in The Globe and Mail on February 7, 2026. It is well written and worth the read.
Ontario’s securities market regulator has faced pressure from Premier Doug Ford’s government to authorize a new class of mutual funds aimed at retail investors that can hold higher-risk private assets such as real estate.
The initiative is being touted as a way to give ordinary investors access to the burgeoning world of privately owned companies and assets, which are mostly only directly available to institutions and sophisticated, wealthy accredited investors.
But investor advocates say private asset investing is riskier and typically more expensive than traditional mutual funds – especially for small investors – and the advocates warn that the plan to create new private asset mutual funds could lead to investors’ money being locked up for years in long-term real estate or infrastructure projects that have extremely complex fee structures.

Three people familiar with the process said the Ford government pushed the Ontario Securities Commission to launch the proposal as a way of raising money for big infrastructure projects. The OSC was urged to prepare a consultation paper unusually quickly, the people said, with the published result containing very little research or industry input.
The Globe and Mail has agreed not to identify the people as they are not authorized to discuss the matter publicly.
Scott Blodgett, a spokesperson for Ontario’s Ministry of Finance, said in an e-mail that while the government discusses capital‑formation initiatives with the OSC and receives updates, it “does not direct or expedite regulatory work.”
“Decisions about long‑term asset fund design, timing and investor safeguards rest solely with the OSC,” Mr. Blodgett said.
OSC spokesperson Julia Mackenzie said the commission’s proposal to launch retail private assets “dates back” to a 2021 report published by the Capital Markets Modernization Taskforce – another regulatory initiative by the Ford government.
At that time, the task force recommended the OSC write a formal proposal on retail private equity investment funds, and then seek public input. The task force said the funds could help close a “funding gap” for smaller companies. Three years later, in the fall of 2024, the OSC launched a consultation paper on retail investors’ access to long-term assets that mentioned the funds could also increase opportunities for additional funding for government infrastructure projects.
“The OSC believes it is important to be open to new and innovative financial products that can enable capital formation and provide new opportunities for investors, with appropriate oversight, disclosure and investor protections,” Ms. Mackenzie told The Globe in an e-mail.
Here is the link to read the rest of this article: Ontario is proposing a new class of mutual funds. Investor advocates warn the risk may not be worth the reward – The Globe and Mail
Published January 28, 2026
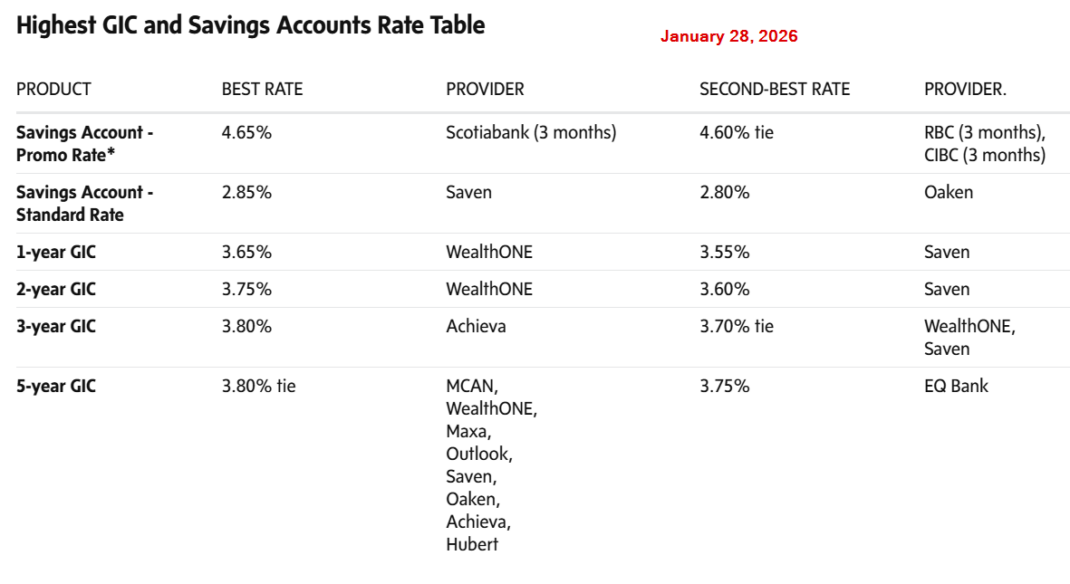
This week’s highest savings account and guaranteed investment certificate rates – The Globe and Mail
Published January 25, 2026
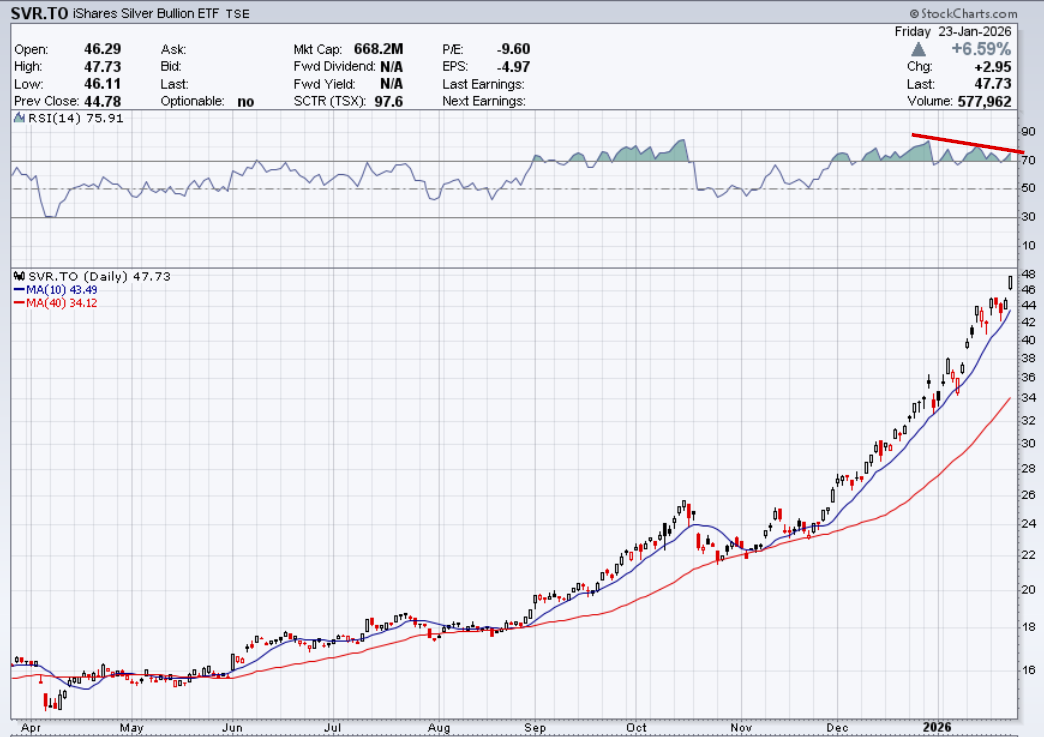
The most prominent divergence is between the Price and the Relative Strength Index (RSI):
There is also a divergence between the ETF Price and the Physical Silver Value:
| Indicator | Signal | Interpretation |
| Price Action | Bullish | SVR is comfortably above its 50-day ($30.76) and 200-day ($21.56) averages. |
| RSI (14-day) | Bearish Divergence | Price is making new highs; RSI is making lower highs (currently ~73). |
| Premium/NAV | Bearish | +3.67% premium is historically unsustainable and suggests “froth.” |
| Candlesticks | Caution | Recent “long-wick” candles near $48 suggest sellers are starting to overpower buyers at these levels. |
In 2026, many traders are using the $44.00 level as their “line in the sand.”
_____________
Note: This technical analysis is for educational purposes. Please conduct your own analysis or consult a financial advisor before making investment decisions. The author of this article may hold long or short positions in the featured stocks or indexes. The article was written with the help of AI and was reviewed by an editor.
© 2026 TradeOnline.ca InvestOnline.ca ChartAnalysis.ca
Published January 24, 2026
The CBC is a federal Crown corporation that operates as Canada’s national public broadcaster. While it generates some of its own money, it is heavily dependent on public subsidies, which cover approximately 70-75% of its operating costs.
The CBC receives an annual “Parliamentary Appropriation” (taxpayer funding) voted on by the federal government.
Yes. The CBC is not 100% publicly funded. It operates a “hybrid” model where it competes for advertising dollars against private companies (like Bell/CTV, Rogers/Citytv) and tech giants (Google/Meta).
| Category | Approximate Amount | Notes |
| Public Funding (Subsidy) | ~$1.4 Billion | The core grant from Parliament. |
| Self-Generated Revenue | ~$450 Million | Ads, subscriptions, licensing. |
| Total Annual Budget | ~$1.85 Billion | Combined operating power. |
| Headcount | ~7,800 | Stabilized after 2024 funding injection. |
The “Revenue Stream” is a major point of friction. Private broadcasters (like Global and CTV) argue that it is unfair for the CBC to receive $1.4 billion in tax money and compete against them for scarce advertising dollars. They argue this subsidized competition makes it harder for private Canadian news outlets to survive. The CBC counters that ad revenue is essential because the public subsidy alone is not enough to maintain its current level of services across TV, Radio, and Digital in both English and French.


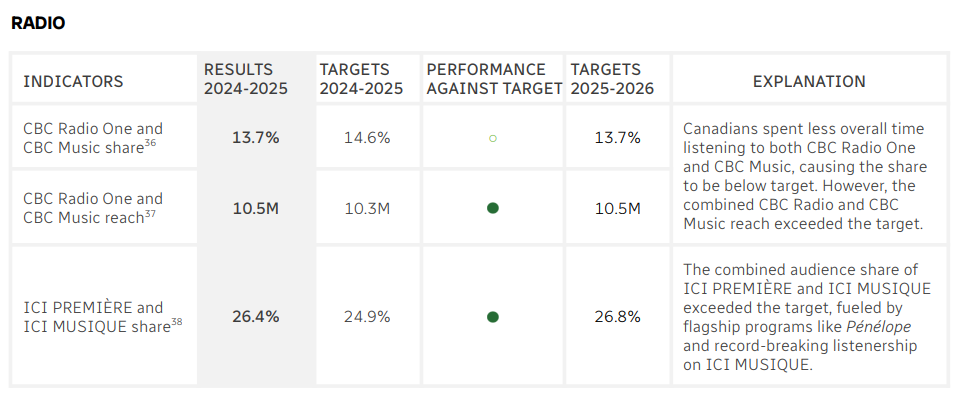
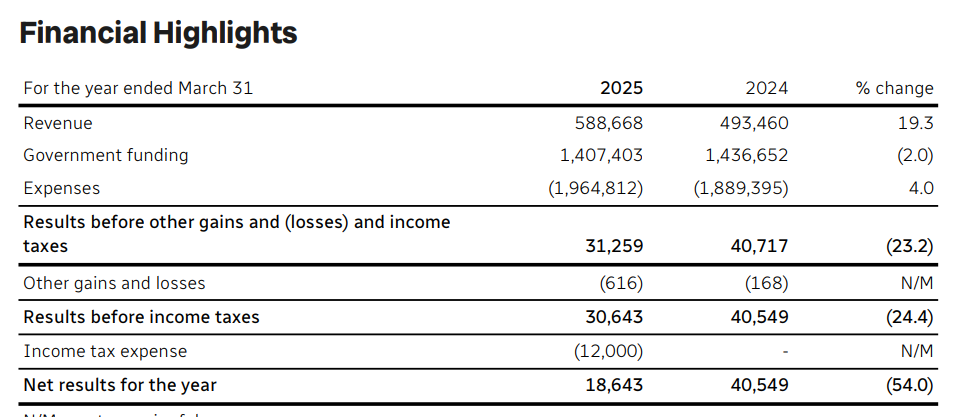
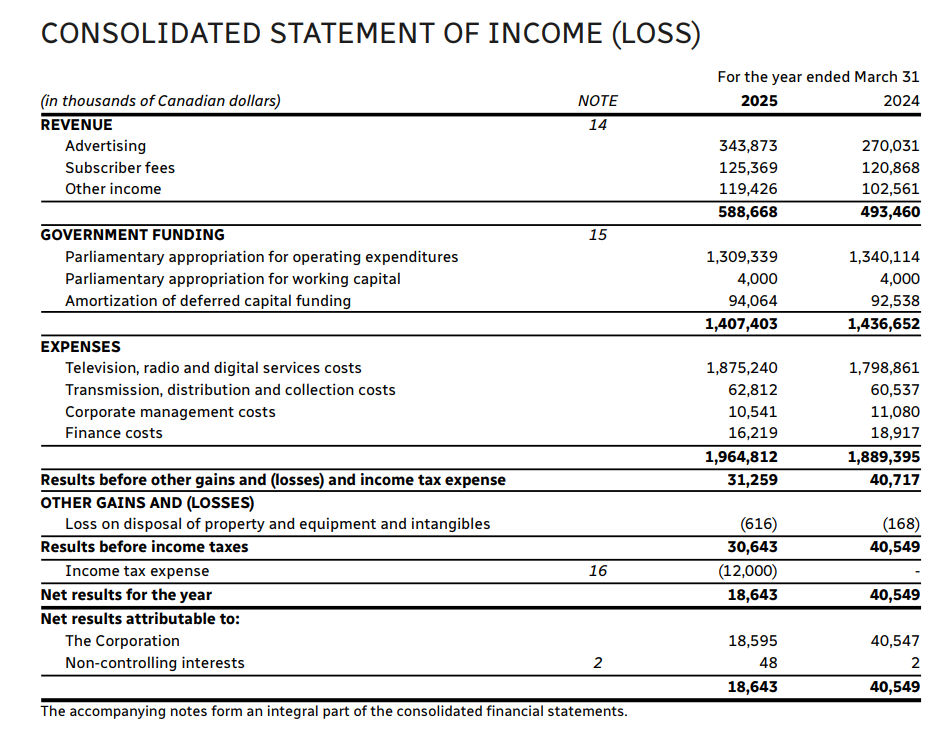
https://cbc.radio-canada.ca/en/impact-and-accountability
Updated link February 11, 2026: I agree that the amount and placement of advertising was awful and disrespectable to the opening ceremonies CBC shouldn’t brush off the over 1,000 complaints it received about ads during Olympics opening ceremony – The Globe and Mail