Posted April 20, 2026
The market is roaring – but these warning lights are flashing red – The Globe and Mail
Posted April 20, 2026
The market is roaring – but these warning lights are flashing red – The Globe and Mail
In early 2026, the software sector entered what analysts have dubbed the “SaaS-pocalypse.” The primary driver is a shift from “SaaS” (Software as a Service) to “AaaS” (Agents as a Service), where autonomous AI agents perform tasks that previously required human users to log into a dashboard.
This shift has created a “Seat Compression” crisis: if AI can do the work of five people, companies no longer need to pay for five software “seats” or licenses.
These companies are at the center of the “seat compression” narrative because AI can now autonomously draft emails, update records, and qualify leads.
The concern here is that generative AI allows non-experts to create professional-grade content, threatening the “pro-tool” moat.
These platforms manage the “plumbing” of a company. AI is now “self-healing” many IT issues before a ticket is even created.
AI has made “low-cost coding” possible, allowing startups to replicate complex security features that previously took years to build.
This was the first sector to be hit by the “AI Replacement” concern.
| Threat Level | Industry | Primary Stock Impacted | The AI “Replacement” Logic |
| Critical | EdTech | Chegg, Duolingo | Free AI models replace paid proprietary content. |
| High | CRM / Sales | Salesforce, HubSpot | AI agents do the work, reducing “seat” counts. |
| Medium | Creative | Adobe | GenAI lowers the skill floor, commoditizing pro tools. |
| Emerging | Workflow | ServiceNow, Atlassian | Autonomous IT “self-healing” reduces service tickets. |
The Bottom Line: For these stocks to recover, they must prove they can monetize AI Outcomes (e.g., charging for a successfully resolved support ticket) rather than Human Access (charging per user login).
While the “SaaS-pocalypse” of early 2026 has decimated many mid-tier software companies, a clear group of “survivors” has emerged. These companies aren’t just weathering the storm; they are thriving by successfully decoupling their revenue from “human seats” and tethering it to AI outcomes.
Here are the software survivors and the strategies they used to outrun the replacement narrative.
Microsoft is the ultimate survivor because they own the “gas” that every other AI agent needs to run.
ServiceNow has avoided the “seat-loss” trap by focusing on operational efficiency rather than just user headcount.
After a brutal 2025, Adobe staged a massive comeback in early 2026 by reinventing how they charge for their tools.
Palantir is widely considered the strongest “pure-play” survivor because they never relied on a per-seat model to begin with.
While still volatile, HubSpot is being labeled a survivor because they “cannibalized themselves” before the market could.
Stocks like CrowdStrike (CRWD) and Palo Alto Networks (PANW) are being viewed as “structural survivors.”
The Logic: AI has made cyberattacks faster and more frequent. You cannot fight an AI-driven attack with a human-driven defense. This has created an inelastic demand for AI-native security software, protecting their business models from seat-count volatility.
Which of these “survival” tactics do you think is most sustainable for the long term: the “tax on compute” (Microsoft) or the “success-based fees” (Salesforce)?
Published April 12, 2026
The market is dominated by a few “hyperscalers” and specialized frontier labs that control the primary compute and foundational models.
Here are the major players in AI, categorized by their role in the ecosystem:
These companies provide the “shovels” for the AI gold rush.
These companies build the “brains” (LLMs and Multimodal models) that power everything else.
The shift in 2026 is away from “chatbots” and toward “agents” that do work autonomously.
| Company | Sector | Key Advantage |
| NVIDIA | Hardware | Monopoly on high-end AI chips. |
| OpenAI | Models | First-mover advantage and massive Microsoft backing. |
| Apple | Edge AI | Apple Intelligence runs private AI on 1B+ local devices. |
| Mistral AI | European AI | The leader in “Sovereign AI” for the EU. |
| Alibaba (Qwen) | Asian AI | Dominates the Chinese market and open-source ecosystem. |
The biggest trend of 2026 is the “ROI Gap”—investors are now pressuring these giants to prove that the trillions spent on chips are translating into actual corporate profits, not just cool demos.
Behind the algorithms and GPUs of 2026 are a handful of individuals whose decisions dictate the direction of global technology. The landscape has shifted recently, with several “Godfathers” of the field moving into advisory or risk-focused roles, while a new generation of “Agentic” leaders has taken over.
Here are the major players leading the AI revolution today:
These individuals lead the organizations building the world’s most powerful models.
Without these individuals, the software labs would have no place to run their code.
These figures provide the intellectual and ethical framework for the industry.
| Individual | Primary Influence | Current 2026 Project |
| Sam Altman | Global Policy & Scaling | GPT-5.4 / “Stargate” Supercomputer |
| Jensen Huang | Hardware & Compute | Rubin Architecture / Omniverse |
| Dario Amodei | Safety & Enterprise | Claude 4.6 / Scaling Laws |
| Yann LeCun | Research Theory | V-JEPA (Joint-Embedding Predictive Architecture) |
The debate over AI is no longer just happening in research papers; in 2026, it is the primary driver of international law. The clash between Effective Accelerationism (e/acc) and AI Safety (Alignment) has created a fragmented regulatory map where a company’s “philosophy” can determine which borders it is allowed to cross.
The global regulatory landscape has split into three distinct “legal zones” based on these philosophies:
| Region | Primary Philosophy | Current Legal Status (April 2026) |
| United States | e/acc / Pro-Growth | A “tug-of-war” between the Federal pro-growth framework and California’s safety mandates. The Remote Access Security Act (RASA) also recently passed to control GPU access to foreign entities. |
| European Union | Human-Centric / Risk-Based | The EU AI Act is now in full force for “High-Risk” systems. The new Digital Omnibus proposal (late 2025) is currently being used to bridge the gap between AI innovation and strict GDPR privacy rights. |
| Global South (India/ASEAN) | Sovereign AI | Led by the India AI Impact Summit (Feb 2026), these nations are rejecting “Western-centric” safety rules in favor of laws that prioritize domestic infrastructure and local language models. |
Yann LeCun (Meta) and Arthur Mensch (Mistral) have successfully lobbied for a “third way.” They argue that transparency through open-source is the only way to prevent a global AI monopoly.
By April 2026, this has resulted in “Transparency Shields” in several jurisdictions (including parts of the EU), where open-weight models receive certain liability exemptions as long as their training data and safety protocols are fully public. This is a direct challenge to OpenAI’s “closed-loop” safety model.
The ultimate impact of these philosophies on global law was supposed to be codified at the Trump-Xi Summit in March 2026. However, due to the escalating Iran conflict, this summit has been pushed to May. For now, the world remains in a state of “Regulatory Arbitrage,” where companies choose their headquarters based on whether they prioritize raw speed (U.S. Federal) or verified safety (EU/California).
Published April 11, 2026
Inflation psychology is the collective belief among consumers and businesses that prices will continue to rise indefinitely. It is often described as a “self-fulfilling prophecy” because when people expect inflation, they change their behavior in ways that actually cause it.
As of April 2026, this concept has returned to the forefront of economic discussion due to a sharp divergence in global markets and renewed geopolitical shocks.
Inflation psychology turns a temporary price spike into a permanent trend through three primary behaviors:
The psychological landscape shifted dramatically this month. On April 10, 2026, the U.S. Consumer Sentiment Index plunged to a record low of 47.6, down from 53.3 in March.
| Driver | Psychological Impact in 2026 |
| Geopolitical Tension | Concerns over the Iran conflict have spiked energy expectations, making consumers feel that “the worst is yet to come.” |
| Tariff Lag | Many businesses are only now passing on the costs of 2025 tariffs as their old inventories run out, creating a “second wave” of price shocks. |
| “Salient” Prices | Households are ignoring aggregate stats (CPI) and focusing on “salient” items—eggs, gas, and home repairs—which remain highly volatile. |
Economics isn’t just math; it’s brain chemistry. Two main biases are driving the 2026 outlook:
Inflation psychology is currently diverging by region:
Central banks, like the Bank of Canada and the Fed, are terrified of “unanchoring.” Once people believe 4% inflation is the new normal, it is incredibly difficult to bring it back to the 2% target without causing a severe recession. Their main tool right now isn’t just interest rates—it’s communication, trying to convince the public that these shocks are temporary to break the psychological loop.
Published by Reuters April 9, 2026
My comments: This is most likely the tip of the iceberg. None will be prosecuted. The Trump team has undermined the integrity of the whole financial system.
By Utkarsh Shetti
April 9 (Reuters) – Some of U.S. President Donald Trump’s major policy decisions have been preceded by well-timed bets, leading some experts to raise questions about whether information had somehow leaked ahead of time.
Here is a list.
April 7, 2026 – IRAN CEASEFIRE ANNOUNCEMENT:
Traders placed a roughly $950 million bet on oil prices falling just hours before the announcement of a ceasefire between the U.S. and Iran.
A combined 8,600 lots of Brent and U.S. crude futures were sold at 1945 GMT on Tuesday, according to LSEG data. At around 2230 GMT, Trump announced a two-week ceasefire with Iran, knocking crude futures down by some 15% to below $100 a barrel at the start of Wednesday’s official trading session.
Separately, the Associated Press reported that a group of new accounts on prediction market platform Polymarket made timely bets on whether a ceasefire would be reached on April 7. Prediction markets offer tradable yes-or-no contracts that let users wager on a broad array of real-world events.
The news agency cited publicly available blockchain data from Polymarket using crypto analytics platform Dune, which showed at least 50 accounts, or wallets, placed “Yes” bets before Trump’s post.
One wallet, created around 10 am ET on the same day, profited $200,000 after betting roughly $72,000, while another user joined the platform on April 6 and won $125,500. A third wallet was created just 12 minutes before Trump’s announcement, raking in an estimated $48,500 after betting $31,908.
Polymarket did not respond to a Reuters request for comment.
March 23, 2026 – IRAN ATTACK PAUSE:
An unidentified trader or traders bet $500 million on Brent and WTI crude futures in a one-minute period shortly before Trump announced a five-day delay to attacks on Iran’s energy infrastructure, after which oil prices crashed 15%, exchange data and Reuters calculations showed.
LSEG data shows 5,100 lots changed hands between 1049 and 1050 GMT, with selling dominating volume. When Trump’s social media post announcing the move hit at 1105 GMT, over 13,000 lots — equivalent to 13 million barrels — traded in 60 seconds, causing Brent to fall to $99 per barrel from $112 and sending WTI down to $86 per barrel from $99.
February 28, 2026 – IRAN STRIKES THAT KILLED SUPREME LEADER AYATOLLAH ALI KHAMENEI
Wagers placed on platforms including Polymarket before the killing of Iranian Supreme Leader Ayatollah Ali Khamenei intensified scrutiny of prediction markets, with Democratic lawmakers calling for a ban on bets tied to military actions that could reward those with privileged information. Kalshi is facing a lawsuit for failing to pay $54 million to people who bet that Khamenei would leave office before March 1. The company says it does not offer markets that settle on death.
According to a Reuters review of Polymarket’s website at the time, about $529 million was wagered on a range of contracts tied to the timing of U.S.-Israeli strikes on Iran, while another $150 million was staked on Khamenei’s removal as supreme leader.
Analytics firm Bubblemaps identified six accounts that made a combined $1.2 million profit from Polymarket bets that were funded in the hours immediately before the raids, which took place on February 28. U.S. Representative Mike Levin of California flagged one specific Polymarket bet placed shortly before the Iran strikes.
Separately, despite hotter-than-expected inflation data that would typically prompt investors to sell long-dated Treasuries, traders moved in the opposite direction on February 27, pushing yields on the benchmark 10-year note below 4%. Analysts said such a pronounced shift into the safe-haven asset would usually be driven by a negative macro event – or a strong expectation that one was imminent.
Shares of U.S. airlines also fell that day as oil prices rose, with the Dow Jones U.S. Airlines Index slipping 5.13%.
January 3, 2026 – U.S. CAPTURE OF FORMER VENEZUELAN PRESIDENT NICOLAS MADURO:
An unknown trader pocketed a profit of roughly $410,000 after wagering on the ouster of Venezuelan President Nicolas Maduro in January.
The trader’s account on Polymarket built up positions in contracts tied to Maduro’s removal on terms that implied long odds before the weekend raid of Maduro’s compound in Caracas by U.S. special forces. Those wagers, worth about $34,000 prior to his capture, surged in value after news of the U.S. military operation emerged on January 3.
April 9, 2025 – TARIFF PAUSE:
Unidentified options traders staked millions of dollars on a U.S. stock market rebound in the minutes before Trump’s tariff pause announcement triggered a massive rally in April last year, according to trading data.
Trump’s Truth Social post pausing tariffs came at 1:18 p.m. ET on April 9, setting off a 9.5% jump for the S&P 500. Market data shows certain options contracts logging a spike in trading activity ahead of it. Some 5,105 SPY call options traded at around 1 p.m. ET for an average price of $4.20.
When stocks rallied, those calls soared as high as around $42, turning $2.14 million into about $21.44 million on paper.
Similarly, other SPY calls betting on the ETF rising above $509 traded at around 1:10 p.m. ET; their value jumped to about $10 million by end of day, up from $624,000.
Reuters could not determine whether the calls were all purchased or sold by one trader or several and whether they closed the position for a gain.
White House spokesman Kush Desai said government ethics guidelines bar federal employees from profiting off nonpublic information. “Any implication that Administration officials are engaged in such activity without evidence is baseless and irresponsible,” he said in an email statement.
Some trades ahead of Trump policy moves raise questions By Reuters
Published April 5, 2026
For a standard Debt-to-Equity (D/E) calculation in 2026, the short answer is yes—you should generally include lease liabilities.
Since the implementation of accounting standards IFRS 16 (and ASC 842 in the U.S.), almost all leases are now recognized on the balance sheet. Because these represent a legal obligation to make future cash payments, most analysts treat them as a form of debt.
To calculate a robust D/E ratio, you aggregate all interest-bearing obligations and contractual payment liabilities. This typically includes:
The comprehensive formula for the ratio looks like this:
$$Debt-to-Equity = \frac{\text{Short-Term Debt} + \text{Long-Term Debt} + \text{Lease Liabilities}}{\text{Total Shareholders’ Equity}}$$
Including lease liabilities can drastically change the profile of a company, especially in sectors that rely heavily on physical footprints.
If you are comparing a company’s current D/E to its historical levels from 10 years ago, remember that the “jump” in debt you might see around 2019–2020 is often just the accounting change (bringing leases onto the balance sheet), not necessarily a sudden spending spree.
When looking at TSX-listed stocks, most Canadian companies report under IFRS, so the lease liabilities will be clearly broken out in the “Liabilities” section of the balance sheet.
Published April 2, 2026
This represents a significant increase from previous years, driven largely by new military outlays, housing initiatives, and rising debt-servicing costs.
The following table breaks down the major spending categories by dollar amount and their approximate percentage of the total budget.
| Category | Amount ($ Billions) | % of Total Budget |
| Direct Program Expenses | $257.0 | 43.9% |
| Major Transfers to Persons | $158.0 | 27.0% |
| Major Transfers to Provinces & Territories | $110.3 | 18.8% |
| Public Debt Charges (Interest) | $55.6 | 9.5% |
| Net Actuarial Losses | $5.0 | 0.8% |
| Total Federal Spending | $585.9 | 100% |
To provide a more granular view, here are the specific costs for the most significant programs within those major categories:
This category covers the operations of all federal departments and new strategic investments.
As an active participant in the Canadian markets, you may find the following “bottom-line” figures relevant to the current trading environment:
Published March 30, 2026
As of early 2026, Canada’s economy is navigating a period of modest growth, with real GDP expanding by 1.6% in 2025 and projected to grow by approximately 0.7% to 1.1% in 2026.
The economy is currently characterized by a “two-speed” performance: strong growth in energy and commodities-producing provinces, contrasted by significant headwinds in manufacturing-heavy regions like Ontario and Quebec due to trade friction and tariffs.
The following table outlines the approximate contribution of major industrial sectors to the Canadian economy and their recent performance trends.
| Sector | Approx. % of GDP | 2025–2026 Performance Trend |
| Real Estate, Rental & Leasing | ~13.5% | Stable at record highs; residential cooling in ON/BC. |
| Manufacturing | ~10.0% | Contracting (-2.6% in 2025); facing U.S. trade tariffs. |
| Mining, Oil & Gas Extraction | ~9.0% | Strong Growth (+4.0% in 2025); upside from oil price shocks. |
| Finance & Insurance | ~7.5% | Growing (+4.0% in 2025); supported by interest margins. |
| Healthcare & Social Assistance | ~7.5% | Consistent growth (+2.6% in 2025); driven by demographics. |
| Construction | ~7.0% | Rebounding in engineering/infra; weak residential starts. |
| Public Administration | ~6.5% | Modest growth (+1.1%); strong federal spending. |
| Professional & Tech Services | ~6.0% | Resilient; tech remains a significant $120B+ industry. |
| Wholesale & Retail Trade | ~10.5% | Volatile; impacted by shifting consumer confidence. |
Energy-producing provinces—Alberta, Saskatchewan, and Newfoundland and Labrador—are outperforming the national average. Recent supply disruptions in the Middle East have pushed oil price forecasts up significantly. Combined with the expanded capacity of the Trans Mountain and Enbridge systems, the sector is seeing material upside in production and revenue.+1
The manufacturing sector remains the largest detractor from national growth. Trade uncertainty and tariffs (particularly on steel, aluminum, and lumber) have led to a third consecutive year of contraction in some sub-sectors. While a U.S. Supreme Court ruling recently struck down some broad 2025 tariffs, specialized duties on automotive and metal products continue to weigh on Central Canada.
The construction sector is seeing a split in performance:
The services sector (accounting for roughly 70% of total GDP) remains the economy’s anchor. Finance, healthcare, and education have provided steady gains that helped Canada avoid a technical recession in 2025, even as the goods-producing side of the economy struggled.
The service sector, also known as the tertiary sector, includes all economic activities that produce “intangible” value rather than physical goods. Instead of extracting raw materials (primary sector) or manufacturing products (secondary sector), the service sector focuses on providing specialized skills, experiences, and logistical support to consumers and businesses.
In modern developed economies, the service sector typically accounts for 70% to 80% of total GDP.
The sector is incredibly broad, ranging from a neighborhood coffee shop to a global data analytics firm. It is generally divided into several key categories:
| Category | Description | Industry Examples |
| Trade & Distribution | The movement and sale of physical goods. | Retail, Wholesale, Warehousing, e-commerce. |
| Consumer Services | Services provided directly to individuals. | Restaurants, Hotels, Tourism, Hair salons, Gyms. |
| Financial Activities | Managing, investing, and protecting money. | Banking, Insurance, Real Estate, FinTech. |
| Professional Services | Specialized expertise for businesses. | Legal, Accounting, Management consulting, Marketing. |
| Information & Tech | Managing data and digital communication. | Software (SaaS), Telecommunications, AI services. |
| Public & Social | Services essential for society’s functioning. | Healthcare, Education, Public safety, Government. |
As economies become more advanced, the service sector is often subdivided into two “knowledge-based” extensions:
This involves the gathering, processing, and distribution of information. It is the “brain” of the economy.
This represents the highest levels of organization and decision-making in society.
To distinguish a service from a good, economists look for four specific traits:
Update for March 31, 2025: The Canadian gross domestic product expanded by 0.2% from the previous month in February of 2026, according to a flash estimate. This was supported by higher output in manufacturing, mining, and quarrying, and financial services, which offset contractions for agriculture and forestry. The expansion is set to extend the 0.1% growth rate from January, which was upwardly revised from the initial estimate of a stall. Growth was carried by goods producing industries (0.2%) as higher construction (2.2%) and mining and quarrying (1.2%) offset the drop for manufacturing (-1.4%). In turn, services producing industries stalled. Output increased in finance and insurance (0.5%), and retail trade (0.8%), offsetting the contraction for wholesale trade (-1.2%) and transportation and warehousing (-0.7%), which was pressured by extreme weather conditions that prevented logistics. source: Statistics Canada
Published March 30, 2026
The 2008 oil price spike, which saw West Texas Intermediate (WTI) crude hit an all-time record of $147.27 per barrel in July, was a “perfect storm” of economic, geopolitical, and financial factors. It wasn’t caused by a single event, but rather a collision of supply and demand that many at the time called the “Third Oil Shock.”
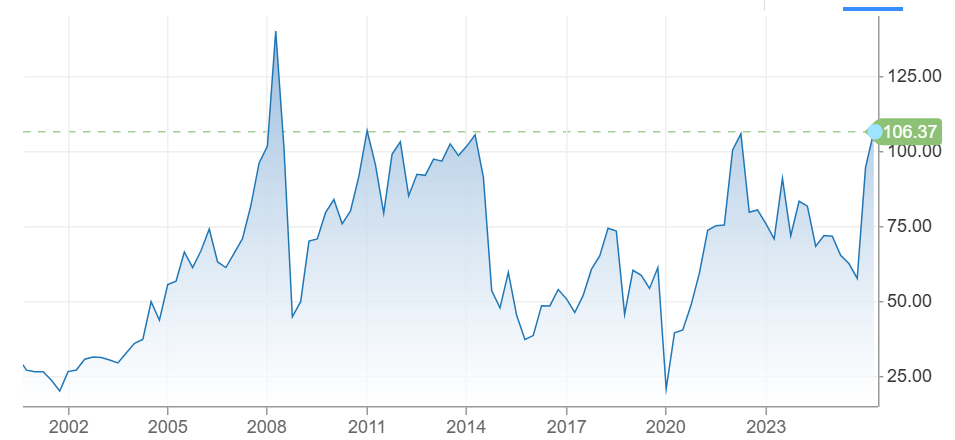
Here is the breakdown of what drove prices into the stratosphere:
The single biggest driver was the rapid industrialization of China and India.
While demand was skyrocketing, the world’s ability to pump more oil had hit a wall.
Investors added a “fear tax” to the price of oil due to constant instability in key producing regions:
Oil is priced globally in U.S. Dollars ($USD$). In 2008, the dollar was losing value rapidly against the Euro and other currencies.
This is the most debated cause. Many analysts believe the “financialization” of commodities played a role.
| Factor | 2008 Peak ($147) | 2026 Context |
| Main Driver | China’s Industrialization | Geopolitical Conflict (ME/Ukraine) |
| Supply | Physical Scarcity Fears | Sufficient Supply (Shale/OPEC+) |
| US Dollar | Record Weakness | Generally Stronger |
| Demand | Rapidly Rising | Transitioning (EVs/Renewables) |
The spike ended abruptly in late 2008 when the global financial system collapsed. Demand vanished almost overnight, and oil plummeted from $147 to under $40 in just six months—one of the most violent “price destructions” in history.
Considering the recent spikes we’ve seen in WTI and HOU.TO, do you think today’s geopolitical tensions are creating a similar “fear premium” to what we saw in 2008?
_____________
Note: This technical analysis is for educational purposes. Please conduct your own analysis or consult a financial advisor before making investment decisions. The author of this article may hold long or short positions in the featured stocks or indexes. The article was written with the help of AI and was reviewed by an editor.
© 2026 TradeOnline.ca InvestOnline.ca ChartAnalysis.ca
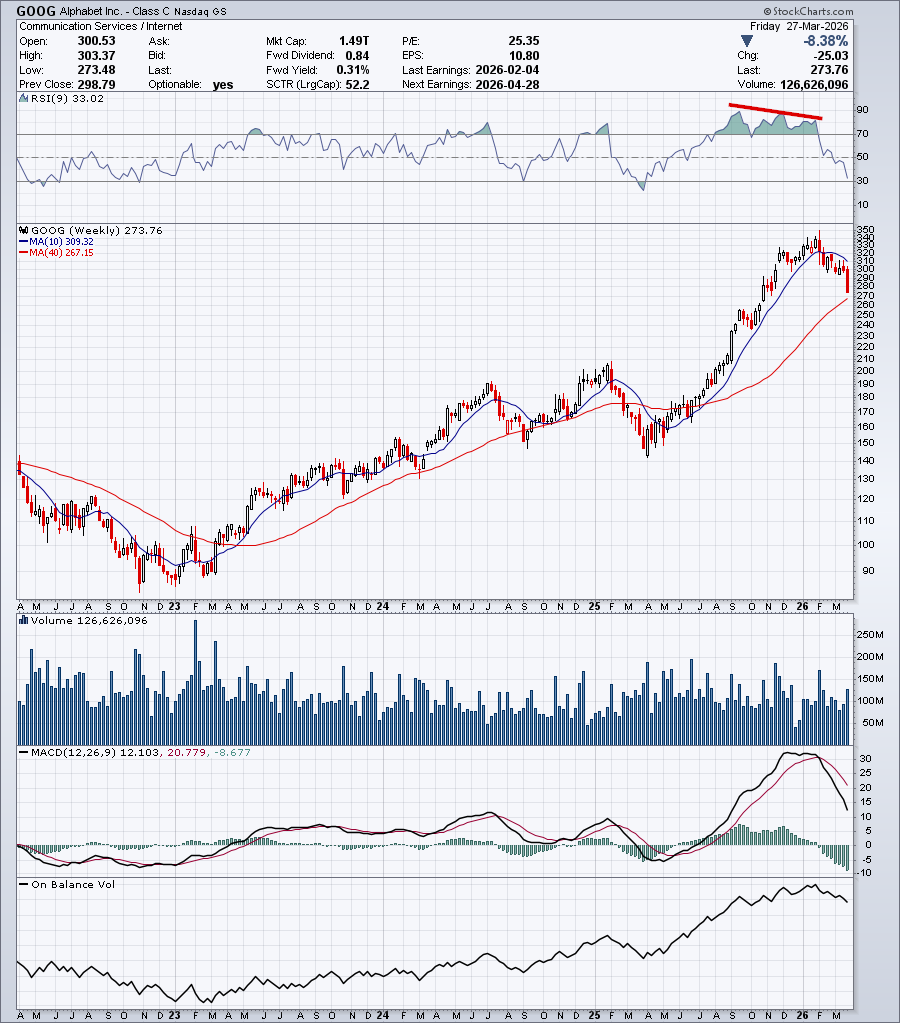
Analysis: This is an educational rear-view mirror post. What was an early indicator of the impending short-term downtrend? You can see the negative divergence on the RSI indicator as a early warning of the short-term downtrend. Can Google hold major support around the 200-day moving average? I say yes, but the market will have the finale say. We can easily be trumped.
_____________
Note: This technical analysis is for educational purposes. Please conduct your own analysis or consult a financial advisor before making investment decisions. The author of this article may hold long or short positions in the featured stocks or indexes. The article was written with the help of AI and was reviewed by an editor.
© 2026 TradeOnline.ca InvestOnline.ca ChartAnalysis.ca
Published March 23, 2026
While the project was initiated under the previous Conservative government, the final decision to “go live” happened in early 2016 under the Liberal government.
Shortly after the second phase, it became clear that thousands of federal employees were being underpaid, overpaid, or not paid at all. In 2017, Judy Foote resigned from cabinet for personal reasons, and the file was eventually handed to Carla Qualtrough, who began the long process of attempting to stabilize the system and searching for a replacement (the “Dayforce” project).
As of 2026, the government is still in the process of transitioning away from Phoenix to the Dayforce system, a project currently overseen by Minister Joël Lightbound.
The company primarily behind the Phoenix pay system is IBM Canada.
While IBM built and implemented the system, the project was a massive undertaking involving several different entities and software components. Here is the breakdown of the “who’s who” behind the system:
IBM was awarded the contract in June 2011 to design, customize, and implement the system.
Phoenix was not built from scratch; it was based on PeopleSoft, a commercial “off-the-shelf” payroll software owned by Oracle Corporation.
The government department (PSPC) acted as the project manager.
Several other high-profile firms were brought in at various stages to audit, advise, or try to fix the mess:
The Current Shift: The government is now moving away from IBM’s Phoenix system toward a new provider, Dayforce (formerly Ceridian), as part of the “NextGen” pay initiative.
Read the following story: Replacing Phoenix pay system will cost at least $4.2-billion, Auditor-General report says – The Globe and Mail