Published January 21, 2026
The stock is currently in the middle of a severe correction, trading near 52-week lows despite posting what looked like solid financial numbers in Q3 2025.

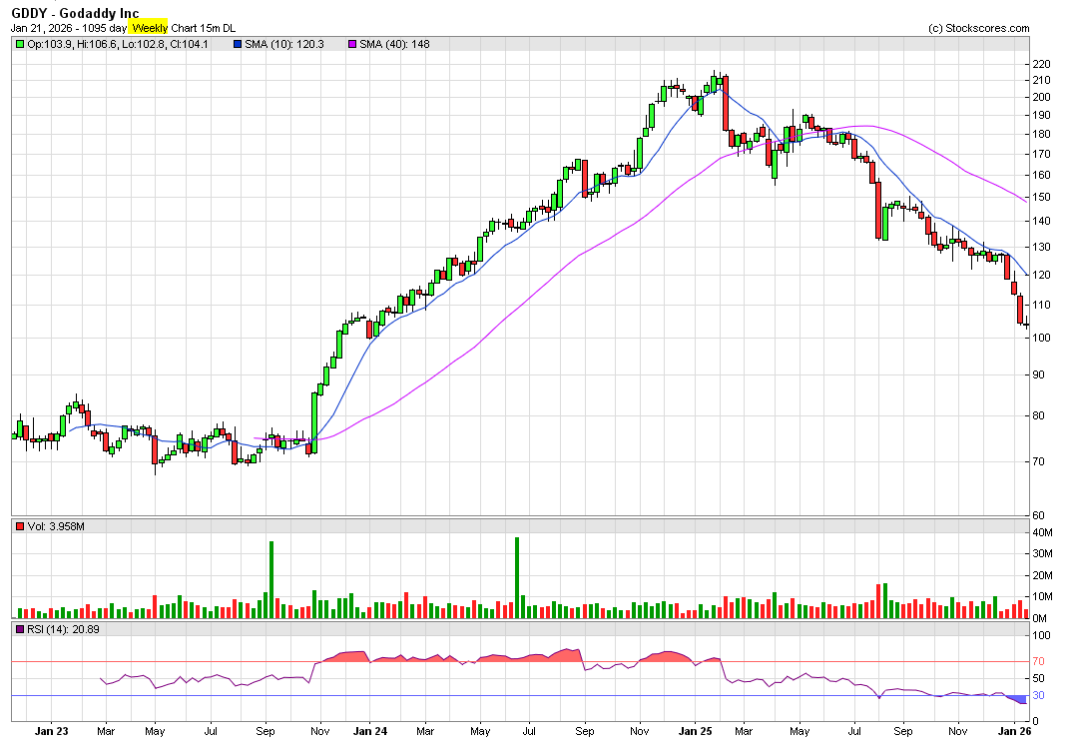
Here is a a 3-year weekly chart showing the major downtrend:
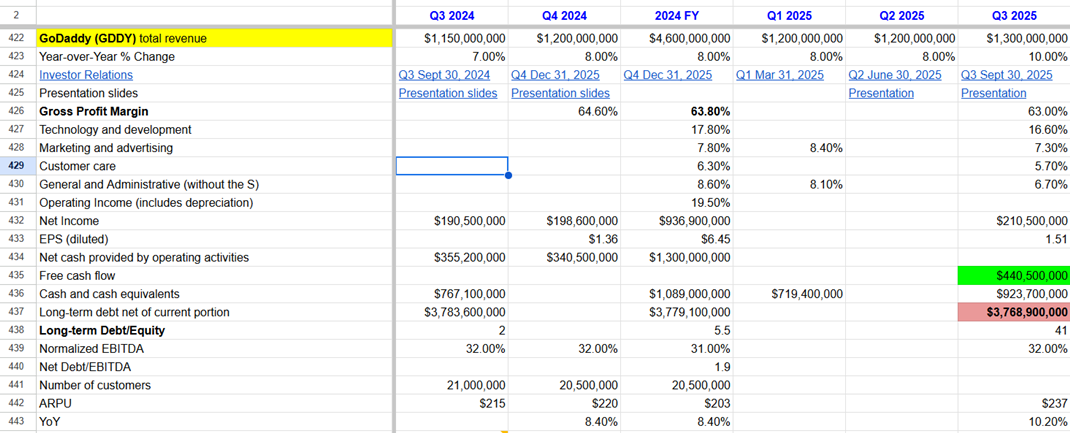
Here is a screenshot of my spreadsheet for GoDaddy:
_____________
Here is the “Executive Summary” of the situation: Wall Street is punishing the stock because it views GoDaddy as a “Legacy” tech company falling behind in the AI race, even though its current cash flow remains strong.
1. Stock Performance Snapshot (Jan 2026)
The stock chart is ugly right now. GoDaddy has been one of the poorer performers in the tech sector to start 2026.
- Current Price: ~$104.00 – $105.00 USD
- Trend: Aggressive Downtrend. The stock is down roughly 14–16% year-to-date (Jan 1–21) and has nearly cut in half from its 2025 highs of ~$216.
- Market Cap: ~$14.8 Billion
- 52-Week Range: $104.03 (Low) – $216.00 (High)
- Recent Catalyst: In the first two weeks of January, multiple analysts (Morgan Stanley, Jefferies, Cantor Fitzgerald) cut their price targets, citing concerns that GoDaddy’s “Airo” AI product isn’t generating revenue fast enough to offset slowing domain growth.
2. Financial Health (The “Disconnect”)
This is the confusing part for many investors. If you look only at the income statement, the company looks fine. The sell-off is driven by sentiment and future growth fears, not current bankruptcy risk.
- Revenue (Q3 2025):$1.32 Billion (+10% Year-over-Year).
- Status: Growing, but “boring” single-digit to low-double-digit growth.
- Profitability (EPS): $1.51 per share (Beat expectations of $1.48).
- Free Cash Flow:$440.5 Million (+21% YoY).
- Critical Stat: GoDaddy is a cash-generating machine. They are generating over $1.2 Billion in free cash flow annually.
- Valuation:
- P/E Ratio: ~15x – 18x (This is considered “cheap” for tech, suggesting it is trading like a utility company rather than a growth stock).
3. The “Bear Case” (Why is it crashing?)
Investors are fleeing the stock for three specific reasons in 2026:
- The “AI Loser” Narrative: The market fears that Generative AI (like ChatGPT or heavily funded startups) will make it too easy for people to build websites without GoDaddy. GoDaddy launched its own AI tool (GoDaddy Airo) to fight this, but early 2026 data suggests adoption hasn’t been the “game changer” investors wanted.
- Insider Selling: In early January 2026, key executives (including the Chief Strategy Officer) sold shares. While often routine, doing so during a stock slide spooked retail investors.
- Domain Saturation: The “Core Platform” (selling domain names) is a mature, low-growth business. Investors are looking for 20%+ growth, and GoDaddy is giving them 7–8%.
4. Upcoming Catalyst: Q4 Earnings
- Estimated Date: Late February 2026 (Likely around Feb 13–15).
- What to Watch:
- Guidance for 2026: This is the only thing that matters. If they guide for revenue growth below 6%, the stock could break under $100.
- Share Buybacks: Because the stock is so “cheap” (low P/E), management has been aggressively buying back their own stock. Watch to see if they announce a new, massive buyback authorization to defend the stock price.
Summary Strategy
- The Bull View: You are buying a cash-cow monopoly at a discount (~$104). The fear is overblown, and their cash flow will fund massive buybacks that force the stock up eventually.
- The Bear View: This is a “Value Trap.” It looks cheap, but revenue growth is permanently slowing because AI is making their core business model (selling website templates) obsolete.
As of January 21, 2026, the competitive landscape has thinned out significantly. The most important update for your comparison is that Squarespace is gone from the public markets, leaving GoDaddy and Wix as the last two major standalone “Website Builder” stocks.
Here is how GoDaddy stacks up against its primary rival (Wix) and the premium e-commerce giant (Shopify) in this current market correction.
1. The “Missing” Competitor: Squarespace (SQSP)
- Status: Private / Delisted.
- What happened: Squarespace was acquired by the private equity firm Permira in late 2024 for roughly $7.2 billion.
- Implication: You can no longer buy Squarespace stock. This actually helps GoDaddy’s “scarcity value”—if an investor wants exposure to the “Do-It-Yourself Website” sector, they essentially have to choose between GoDaddy and Wix.
2. Head-to-Head: GoDaddy (GDDY) vs. Wix (WIX)
This is the main battle. Both stocks are currently down, but for different reasons.
| Feature | GoDaddy (GDDY) | Wix.com (WIX) |
| Stock Price | ~$104 USD | ~$76 – $80 USD |
| Valuation (P/E) | ~15x – 16x (Value Stock) | ~30x – 34x (Growth Stock) |
| The “Vibe” | “The Cash Cow” | “The Fallen Star” |
| Why it’s down | Fear of AI obsolescence; slow growth. | Valuation compression; losing premium status. |
| Cash Flow | Massive (~$1.2B/year). | Growing, but less stable than GDDY. |
The Analysis:
- GoDaddy is the “Safe” Play: It trades at half the valuation of Wix (15x vs 30x). Wall Street treats it like a utility company—boring, reliable cash flow, low growth.
- Wix is the “High Beta” Play: Wix is trading at a much higher premium because it historically grew faster. However, its stock has crashed harder recently (down significantly from its 52-week highs of ~$230) as investors question if it deserves that premium in an AI world.
3. The “Premium” Alternative: Shopify (SHOP)
While not a direct competitor for “simple” websites, Shopify is often grouped in the same basket.
- Price: ~$167 USD
- Status: The clear leader. While GoDaddy and Wix fight for the “small local business” market (Pizza shops, Plumbers), Shopify owns the “Online Retail” market.
- Valuation: Extremely expensive compared to GDDY. You pay a massive premium for Shopify because its growth is structurally higher.
Summary Comparison Table (Jan 2026)
| Company | Status | Valuation Risk | Primary Investor Fear |
| GoDaddy | Public | Low (Cheap at 15x P/E) | “Will AI replace domain names?” |
| Wix | Public | High (Expensive at 30x P/E) | “Can they justify this premium?” |
| Squarespace | Private | N/A | Taken private to fix issues away from public eye. |
| Shopify | Public | Medium (Priced for perfection) | “Consumer spending recession.” |
Strategic Conclusion
- If you want “Value”: GoDaddy is arguably the safest bet. Even if it doesn’t grow fast, the massive share buybacks (funded by that $1.2B cash flow) put a “floor” under the stock price around $95–$100.
- If you want “Rebound Potential”: Wix has fallen so far that a simple earnings beat could send it up 20% in a day. It is the riskier, higher-reward trade.
As of January 2026, the short interest data for GoDaddy (GDDY) tells a very specific story: This is NOT a “hated” stock.
Despite the ugly stock chart, hedge funds are not aggressively betting on GoDaddy’s collapse. The selling pressure you are seeing is likely coming from “Long Only” funds selling their shares (profit-taking or rotation), rather than short sellers piling in.
Here is the breakdown of the data found for mid-January 2026.
1. The “Headline” Number
- Short Interest (% of Float): ~4.2%
- The Verdict:Low / Normal.
- Context: A “Crowded Short” (like GameStop in 2021 or a failing bank) typically has short interest above 20%.
- Peer Comparison: GoDaddy is actually shorted less than its peer group average (which hovers around ~8–9%). This means Wall Street sees GoDaddy as safer than many other mid-cap tech stocks.
2. The “Squeeze” Indicator (Days to Cover)
- Days to Cover: ~4.1 to 4.5 Days
- What this means: If all the short sellers decided to cover (buy back) their shares at once, it would take them roughly 4.5 days of normal trading volume to do it.
- Analysis: This is moderately elevated.
- Usually, anything over 5 days is considered “Squeeze Territory.”
- While not extreme, a 4.5 ratio means that if GoDaddy releases a surprise positive earnings report in February, the stock could “pop” 10–15% very quickly because those short sellers would scramble to get out.
3. Institutional Ownership (The “Smart Money”)
- Ownership: >90% (Very High).
- The Player: The biggest holders are the “Big Three” (Vanguard, BlackRock, State Street).
- The Signal: When institutional ownership is this high, it confirms that the stock is widely held in pension funds and ETFs. The recent price drop is likely due to ETF rebalancing or sector rotation (funds selling “Tech” to buy “Energy” or “Defense”), rather than a loss of faith in the company itself.
Summary Table
| Metric | Current Level | Sentiment |
| Short % of Float | 4.2% | Neutral/Safe (Not a target). |
| Days to Cover | 4.5 | Moderate (Minor squeeze potential). |
| Trend | Declining | Shorts are actually closing positions, not adding new ones. |
Strategic Takeaway
Since the Short Interest is low (4%), you cannot rely on a “Short Squeeze” to save the stock. It has to rise on fundamental merit (Earnings).
- Bull Case: The sellers are exhausted. With shorts not adding pressure, any good news will lift the stock easily.
- Bear Case: There is no “guaranteed buyer” (short cover) waiting in the wings. If earnings are bad, the stock will drift lower naturally.
The date you need to circle on your calendar is Thursday, February 12, 2026.
While GoDaddy has not yet issued the official press release confirming the exact minute, historical patterns and analyst consensus point to this date.
The Event Details
- Date: Thursday, Feb 12, 2026 (Estimated)
- Time: After Market Close (approx. 4:05 PM ET)
- The Report: Q4 2025 Earnings & Full Year 2026 Guidance
Why this specific date matters
This is the “Show Me” quarter. The stock has drifted down for three weeks because investors are nervous about the 2026 outlook. This report will resolve that anxiety one way or the other.
The “Pass/Fail” Metrics: The algorithms will react instantly to three specific numbers. You can write these down to grade the report yourself when it drops:
- Revenue Growth: Wall Street expects ~$1.27 Billion.
- The Danger Zone: If they miss this number, it confirms the “AI is killing their business” narrative.
- Profit (EPS): Consensus is $1.58 per share.
- The Bull Signal: GoDaddy has beaten earnings estimates in 3 of the last 4 quarters. If they post something like $1.65+, it proves their cost-cutting is working better than expected.
- The “Wild Card”: Buyback Authorization
- With the stock near 52-week lows, watch for a sentence in the press release saying: “Board authorizes a new $1 Billion share repurchase program.” That single line would likely send the stock up 10% immediately.
Recommendation: Do not buy “Call Options” for this event unless you are willing to lose 100% of the premium. The “Implied Volatility” will be expensive. If you like the stock, the safer play is to simply hold the shares or sell “Put Options” at the $95 strike to buy it cheaper if it crashes.
GoDaddy Inc. – Investors for the latest financials.
_____________
Technical Analysis is about trading with the trend
Note: This technical analysis is for educational purposes. Please conduct your own analysis or consult a financial advisor before making investment decisions. The author of this article may hold long or short positions in the featured stocks or indexes. The article was written with the help of AI and was reviewed by an editor.
© 2026 TradeOnline.ca InvestOnline.ca ChartAnalysis.ca