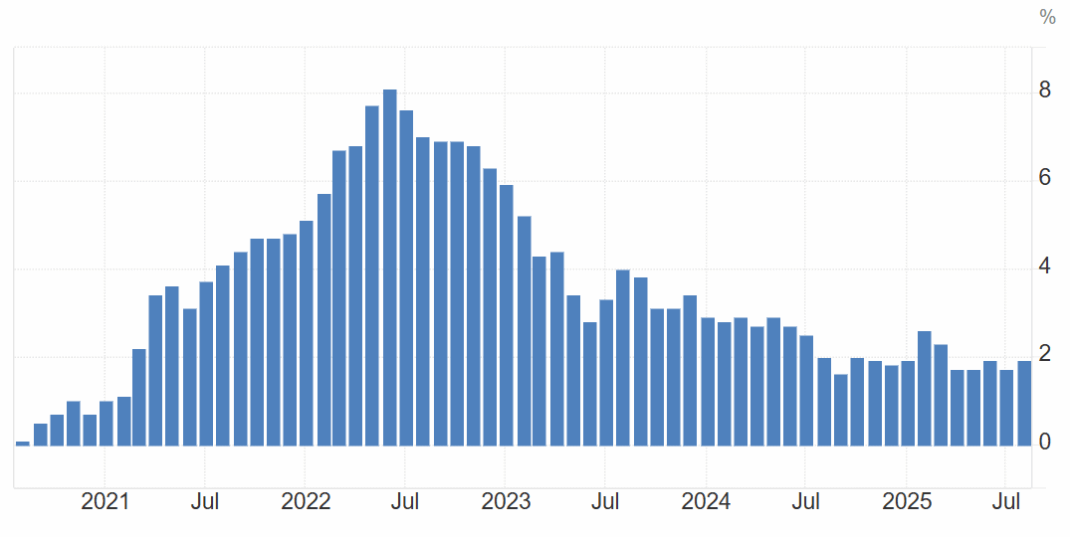
Analysis: Excluding gasoline, the CPI rose 2.4% in August, after increasing 2.5% in each of the previous three months. In August, prices for meat rose 7.2% year over year, following a 4.7% increase in July. Higher prices for fresh or frozen beef (+12.7%) and processed meat (+5.3%) put upward pressure on the index in August. Inflation is smoldering in the background and will get worst.
Analysis: Here is a 4-year candlestick chart for the index. It is overextended and due for consolidation or a pull back. But at this stage; the major trend is up, the intermediate trend is up and the the near-term trend is up.
The S&P/TSX Composite Index is a key benchmark for the Canadian stock market, representing a diverse range of sectors. As of August 2025, the index includes the following major sectors and their approximate weightings:
Sector
Approximate Weighting
Financials
32%
Energy
16%
Materials
12%
Industrials
10%
Consumer Discretionary
8%
Technology
7%
Real Estate
6%
Utilities
5%
Healthcare
4%
Sector Breakdown
Financials
The financial sector is the largest component of the TSX, driven by major banks like the Royal Bank of Canada (RBC) and Toronto-Dominion Bank (TD). This sector has seen strong performance due to robust earnings and lower loan loss provisions.
Energy
The energy sector benefits from rising oil prices and accounts for a significant portion of the index. Companies in this sector are influenced by global demand and geopolitical factors.
Materials
The materials sector includes mining and resource companies, which are sensitive to commodity prices. This sector has been performing well, reflecting the demand for natural resources.
Industrials
The industrials sector encompasses a variety of companies involved in manufacturing, transportation, and infrastructure. It has shown steady growth, supported by infrastructure investments.
Consumer Discretionary
The consumer discretionary sector includes retail and consumer goods companies. This sector has gained traction due to expectations of economic recovery and consumer spending.
Technology
The technology sector has emerged as a growth driver, particularly with advancements in AI and digital transformation. Companies like Shopify are leading this charge.
Real Estate
The real estate sector focuses on property management and development, with a growing emphasis on ESG (Environmental, Social, and Governance) criteria.
Utilities
The utilities sector provides essential services and tends to be more stable, making it a defensive investment during market volatility.
Healthcare
The healthcare sector includes pharmaceutical and biotechnology companies. It remains resilient, particularly with innovations in treatments and medical technologies.
This diverse sector composition reflects the overall health and dynamics of the Canadian economy, with various sectors contributing to the index’s performance.
Written with the help of AI and reviewed by an editor.
_____________
Technical Analysis is about trading with the trend
Note: This technical analysis is for educational purposes. Please conduct your own analysis or consult a financial advisor before making investment decisions. The author of this article may hold long or short positions in the featured stocks or indexes.
Canada’s economy saw a contraction in the second quarter of 2025, following a period of modest growth earlier in the year. The latest data and forecasts point to a challenging economic environment driven by global trade uncertainty.
Recent GDP Data (Q2 2025)
Real GDP Growth Rate: According to advance estimates from Statistics Canada, real GDP was essentially unchanged in the second quarter of 2025 after a sharp increase in the first quarter. Monthly data showed a decline in GDP in both April and May, followed by a slight rebound in June.
Key Factors: The contraction was primarily driven by a sharp drop in exports, particularly to the United States. This was a direct result of trade activity being pulled forward into the first quarter to front-load shipments in anticipation of new tariffs. Sectors like manufacturing and mining, quarrying, and oil and gas extraction saw a decline, while services were largely flat.
Outlook and Forecast
The outlook for the remainder of 2025 and into 2026 is cautious, with many economists predicting a period of very slow growth or even a mild recession.
Bank of Canada: The Bank of Canada, in its July 2025 Monetary Policy Report, noted that while the economy has shown some resilience, GDP is estimated to have contracted in the second quarter. The Bank’s forecast is for modest growth in the second half of 2025, but it acknowledges that the unpredictable nature of global trade policy poses a significant risk.
Fiscal Forecasts: The Parliamentary Budget Officer’s June 2025 report anticipated that real GDP would be flat in the second quarter, largely due to the impact of tariffs.
General Consensus: The general consensus among major Canadian banks and other forecasters is that the economy will continue to face headwinds. A survey by the Bank of Canada found that a significant portion of market participants believe there is a notable probability of a recession in the next 12 months.
Canada’s economic performance has been a mixed bag recently, with the latest data and forecasts pointing to a period of slow or flat growth after a surprisingly strong start to the year.
Recent GDP Data
Real GDP Growth Rate: According to advance estimates from Statistics Canada, Canada’s real GDP was essentially flat in the second quarter of 2025 (April-June), a notable slowdown from the 2.2% annualized growth seen in the first quarter.
Monthly Breakdown: The flat quarterly result was a combination of monthly declines in April and May, followed by a small rebound in June. This indicates a loss of momentum in the middle of the year.
Key Factors and Industry Performance
Exports and Trade: The slowdown in the second quarter was largely a result of trade-related issues. Exports, particularly to the United States, fell sharply after a pre-tariff-related surge in the first quarter. This was a key drag on the economy.
Goods vs. Services: The goods-producing sector, including manufacturing and mining, saw declines, while the services sector remained relatively flat.
Household Spending: Consumer spending has held up better than expected, and residential investment has shown some signs of bouncing back. However, the overall consumer environment is seen as cautious.
Outlook and Forecast
The outlook for the Canadian economy remains uncertain, with a wide range of forecasts from different institutions.
Bank of Canada: The Bank of Canada has noted the volatility and uncertainty surrounding global trade. In its recent reports, the Bank acknowledges the slowdown in economic activity but continues to project a gradual path to recovery, assuming trade tensions do not escalate significantly.
Private Sector Forecasts: Many economists are forecasting a period of weak growth for the rest of 2025. Some anticipate growth of less than 1% for the year as a whole, while others see a risk of a mild recession, defined as two consecutive quarters of negative growth. The primary risks to the outlook are a further increase in global trade tensions and a weaker-than-expected U.S. economy, as the U.S. is Canada’s largest trading partner.
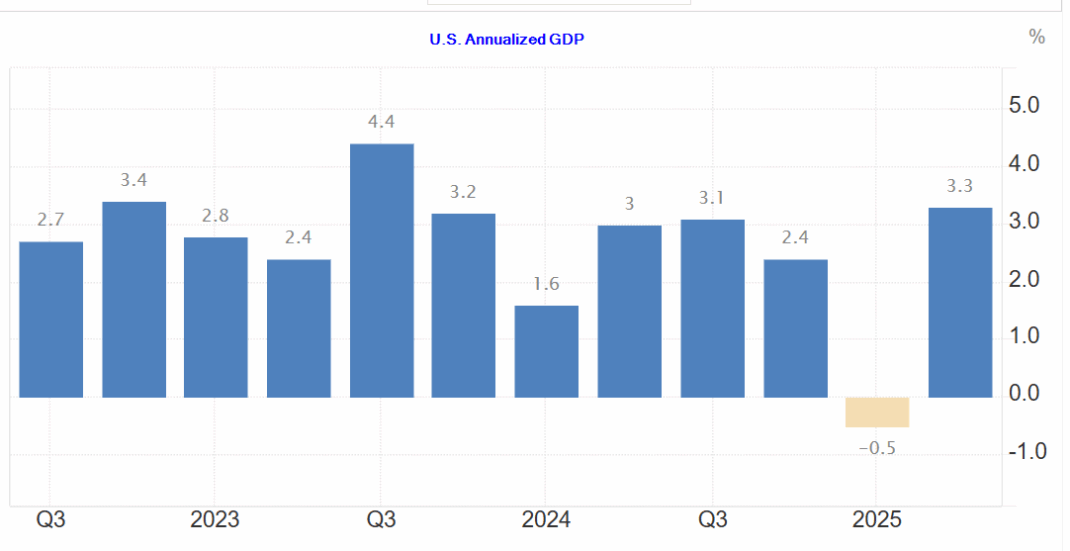
The most recent data from the U.S. Bureau of Economic Analysis (BEA) shows that the U.S. economy’s real Gross Domestic Product (GDP) grew at a strong rate in the second quarter of 2025.
Key Figures (Q2 2025)
Real GDP Growth Rate: The U.S. real GDP increased at an annual rate of 3.3% in the second quarter of 2025 (April, May, and June). This was an upward revision from the initial estimate of 3.0% and represents a significant rebound from the 0.5% decrease in the first quarter of the year.
Nominal GDP: The nominal, or current-dollar, GDP for the second quarter was $30.33 trillion.
Key Drivers of Growth
The increase in real GDP in the second quarter primarily reflected:
Increased Consumer Spending: An acceleration in personal consumption expenditures was a major factor, with Americans spending more on both goods and services.
Decreased Imports: A notable downturn in imports contributed to the GDP increase, as imports are a subtraction in the GDP calculation. This was partly a result of businesses and consumers having stockpiled goods in the first quarter in anticipation of new tariffs.
Outlook and Forecast
While the second quarter saw robust growth, the outlook for the rest of 2025 and 2026 is somewhat mixed, with many forecasters predicting a slowdown.
Forecasts: According to forecasts from organizations like the Federal Reserve Bank of Philadelphia and EY, real GDP growth is expected to decelerate in the second half of 2025 and into 2026. This is largely due to the anticipated impact of trade barriers and a cautious consumer environment.
GDPNow: The Atlanta Fed’s GDPNow model currently projects a slower growth rate for the third quarter of 2025, with an estimate of 2.2%. This forecast is updated regularly based on incoming economic data.
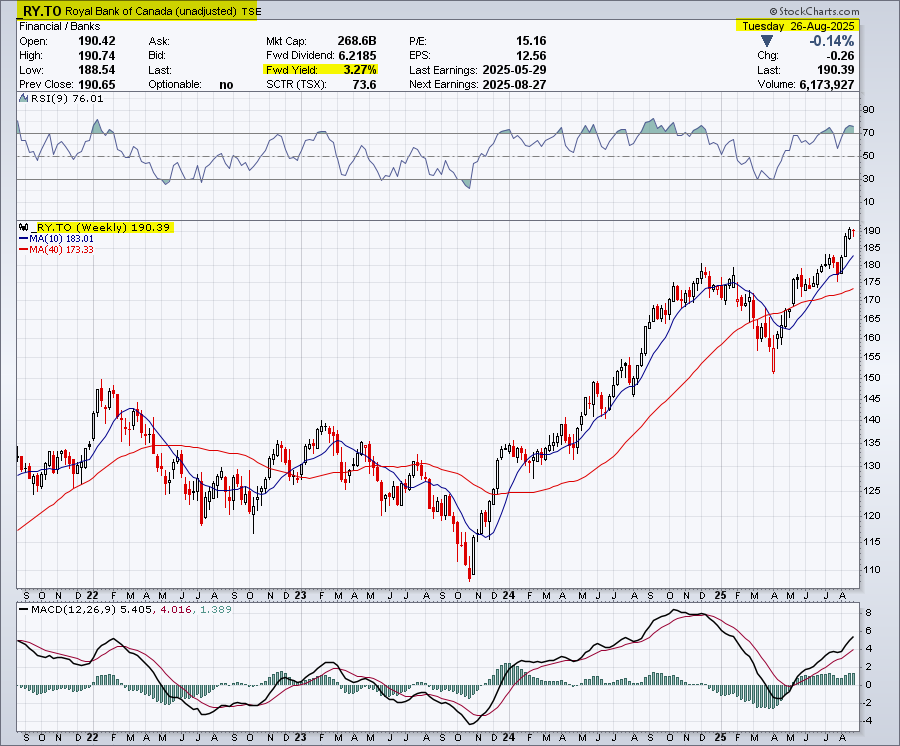
Adjusted earnings per share were $3.84, well above the average analyst expectation of $3.29 per share, according to S&P Capital IQ.
Here is a 4-year candlestick chart:
Royal Bank of Canada (RBC) is a Canadian multinational financial services company and the largest bank in Canada by market capitalization. Founded in 1864, it operates globally and is a publicly traded company on the Toronto, New York, and SIX Swiss exchanges under the symbol RY.
Business Segments and Services
RBC is a diversified financial institution with five main business segments:
Personal and Commercial Banking: This is its largest segment, offering a wide array of financial products and services to individuals and businesses in Canada, the U.S., and the Caribbean. This includes credit cards, mortgages, loans, and everyday banking.
Wealth Management: Providing investment and wealth management solutions to clients worldwide. This segment includes its brokerage firm, RBC Dominion Securities, and RBC Global Asset Management.
Capital Markets: This is the investment banking arm, providing corporate and investment banking services, including mergers and acquisitions, debt and equity financing, and global markets solutions to corporations and institutional investors.
Insurance: Offering a range of life, health, home, auto, travel, and wealth insurance products for individuals and groups.
Investor and Treasury Services: Providing asset services, cash management, and treasury services to institutional clients.
Recent Financial Performance
In the third quarter of 2025, RBC reported a record net income of $5.4 billion, a significant increase from the previous year. This growth was driven by strong performance across all business segments, particularly in Capital Markets and Personal Banking. The bank also increased its quarterly dividend and maintained a robust capital position.
Technical Analysis is about trading with the trend
Note: This technical analysis is for educational purposes. Please conduct your own analysis or consult a financial advisor before making investment decisions. The author of this article may hold long or short positions in the featured stocks or indexes.
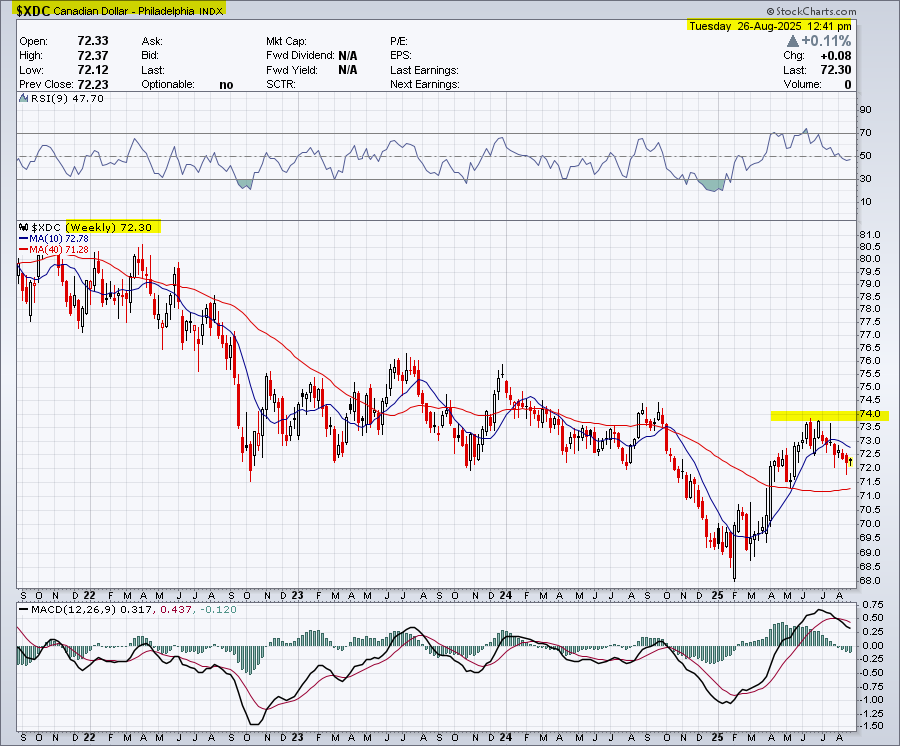
Analysis: Canadian dollar still in a major downtrend, intermediate downtrend and near-term downtrend. The major resistance point is around $0.7400 and support will be around the 200-day simple moving near $0.7100
Here is the 4-year candlestick weekly chart for the Canadian dollar.
The Canadian dollar, often referred to as the “loonie,” is the official currency of Canada. Its value is determined by supply and demand in the foreign exchange market, and it is influenced by a variety of domestic and international factors.
Current Exchange Rates
As of August 26, 2025, the value of the Canadian dollar is approximately:
1 CAD = $0.72 USD
1 CAD = €0.62 EUR
1 CAD = £0.54 GBP
Factors Influencing the Canadian Dollar
Commodity Prices: Canada is a major exporter of natural resources, especially oil. As a result, the value of the Canadian dollar is highly correlated with global commodity prices. When oil prices rise, the CAD tends to strengthen, and when they fall, it tends to weaken.
Monetary Policy and Interest Rates: The Bank of Canada (BoC) sets the key policy rate, which is a major tool for controlling inflation and influencing the economy. Higher interest rates in Canada, relative to other countries, can attract foreign investment and increase the demand for the Canadian dollar, leading to a stronger currency.
Current Interest Rate: As of July 30, 2025, the Bank of Canada’s target for the overnight rate is 2.75%.
Next Announcement: The next scheduled interest rate announcement is on Wednesday, September 17, 2025.
Economic Health: The overall health of the Canadian economy, including factors like GDP growth, inflation, and unemployment, plays a significant role in the currency’s value. A strong economy typically supports a stronger currency.
U.S. Economy and Trade: The United States is Canada’s largest trading partner. Therefore, the economic performance of the U.S. and the trade relationship between the two countries have a substantial impact on the Canadian dollar.
Current Account and Public Debt: A country’s current account balance (the balance of trade in goods, services, and payments) and its level of public debt can also affect its currency. A trade surplus can put upward pressure on the currency, while a large public debt can make a country less attractive to foreign investors.
_____________
Technical Analysis is about trading with the trend
Note: This technical analysis is for educational purposes. Please conduct your own analysis or consult a financial advisor before making investment decisions. The author of this article may hold long or short positions in the featured stocks or indexes.
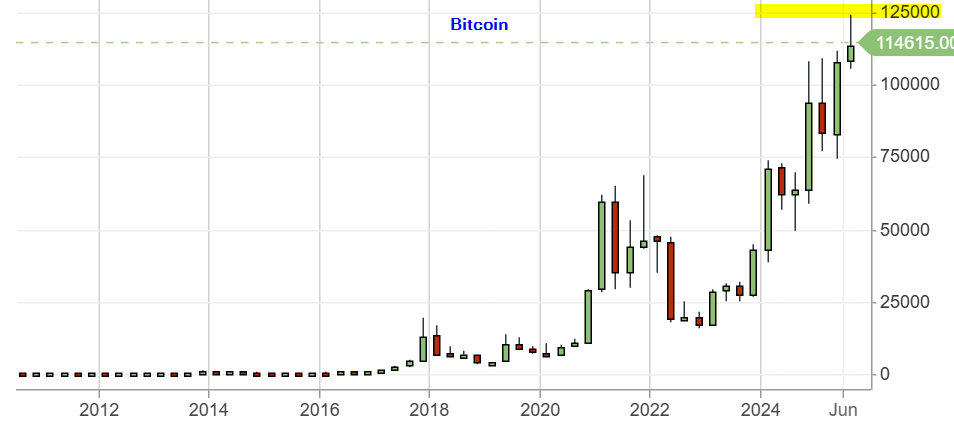
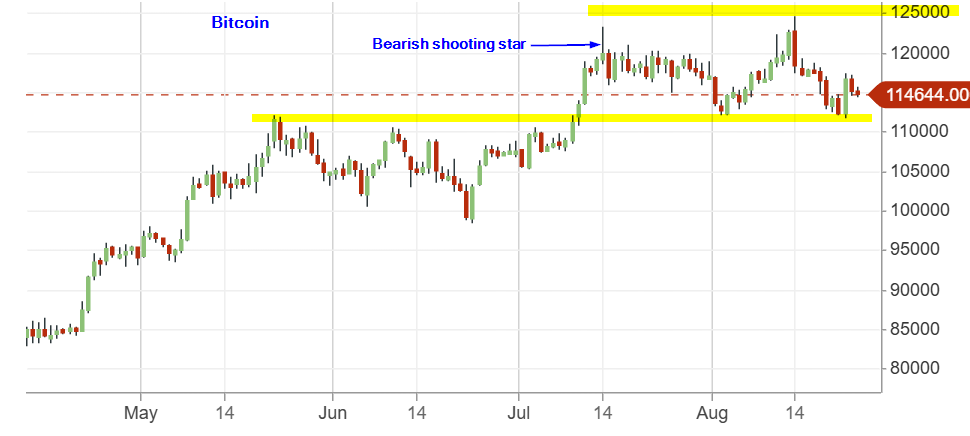
Here is the long-term chart showing the major uptrend
Here is a intermediate daily candlestick chart showing the consolidation zone
What is Bitcoin?
Bitcoin is a fascinating and complex topic that has become a major force in the global financial landscape. Here’s a breakdown of what it is, how it works, and its current state.
Bitcoin (BTC) is a decentralized digital currency, also known as a cryptocurrency. It was created in 2009 by an anonymous person or group of people using the pseudonym Satoshi Nakamoto. Unlike traditional currencies like the U.S. dollar or Canadian dollar, Bitcoin is not controlled by a central authority, such as a government or a bank.
Its core principles are:
Decentralization: The network is run by a global peer-to-peer network of computers, not a single entity.
Blockchain Technology: All transactions are recorded on a public, distributed ledger called the blockchain. This ledger is transparent, permanent, and secured by cryptography, making it nearly impossible to tamper with.
Limited Supply: There will only ever be 21 million Bitcoins created. This scarcity is a key part of its value proposition, making it a “digital gold” or a hedge against inflation.
How Does it Work?
Transactions: When you send Bitcoin to someone, the transaction is broadcast to the network.
Mining: Computers on the network, known as “miners,” compete to verify and add new “blocks” of transactions to the blockchain. This process, called “mining,” involves solving complex mathematical problems.
Security and Trust: Once a block is added, it is permanently linked to the previous blocks. This “chain” of blocks creates a secure and unchangeable record of all transactions.
Wallets: Users access their Bitcoin and interact with the network through a “digital wallet,” which holds the cryptographic “keys” that prove ownership of the Bitcoin.
Current State and Trends
Bitcoin has seen a volatile but generally upward trend in its price since its inception. After years of being a niche asset, it has gained significant mainstream attention, with both retail and institutional investors entering the market.
Key trends include:
Institutional Adoption: Major financial institutions, including investment banks and asset managers, are increasingly exploring Bitcoin. The approval of spot Bitcoin ETFs in various countries has made it easier for traditional investors to gain exposure to Bitcoin without directly holding the cryptocurrency.
Halving Events: The Bitcoin network undergoes a “halving” approximately every four years, which cuts the reward for mining a new block in half. This reduces the rate at which new Bitcoin is created, contributing to its scarcity. Historically, halvings have often been followed by significant price increases. The most recent halving occurred in April 2024.
Market Volatility: Bitcoin remains highly volatile and is subject to significant price swings. Factors such as macroeconomic events, regulatory changes, technological developments, and overall market sentiment can all influence its price.
Debate Over Utility: While some see Bitcoin as a potential alternative to traditional currencies for payments, its slow transaction times and high fees have led many to view it more as a store of value or a speculative asset. Other cryptocurrencies, often referred to as “altcoins,” have emerged to address some of Bitcoin’s scalability challenges.
Risks and Future Outlook
Investing in Bitcoin comes with significant risks:
Price Volatility: Its price can fluctuate dramatically, and there is no guarantee of returns.
Regulatory Uncertainty: Governments and financial regulators around the world are still developing their stances on cryptocurrency, and new regulations could impact its value.
Security: While the blockchain itself is secure, the private keys to a user’s wallet can be vulnerable to loss or theft, and once gone, the Bitcoin is gone forever.
Despite these risks, many analysts and investors remain bullish on Bitcoin’s long-term future. They believe that its limited supply, decentralized nature, and growing acceptance as a legitimate asset class will continue to drive its value. Bitcoin’s journey from a niche technology to a globally recognized asset has been remarkable, and its ongoing evolution will be a major story in the financial world for years to come.
How high can bitcoin go in the long run?
Predicting the future price of Bitcoin is impossible, and any specific figures are purely speculative. The cryptocurrency market is famously volatile and influenced by a wide array of unpredictable factors. However, we can analyze the key drivers that analysts and proponents believe could push Bitcoin’s price significantly higher in the long run.
The bullish arguments for Bitcoin reaching unprecedented highs are generally based on a few core principles:
Fixed and Scarce Supply: This is the most fundamental argument. There will only ever be 21 million Bitcoins created. This hard cap, combined with the “halving” events that reduce the rate of new Bitcoin creation every four years, creates a supply shock that could lead to significant price appreciation if demand continues to grow.
Growing Institutional Adoption: This is a major factor. The approval of spot Bitcoin ETFs in the U.S. and other countries has opened the floodgates for large-scale institutional investment. As pension funds, hedge funds, and other institutional players allocate a small percentage of their portfolios to Bitcoin, the sheer volume of capital could drive the price up dramatically.
Global Macroeconomic Trends: Proponents view Bitcoin as a hedge against inflation and a safe-haven asset in a world of geopolitical instability and currency debasement. As central banks continue to print money and national debts rise, some investors may look to a decentralized, non-sovereign asset like Bitcoin as a store of value.
Network Effects and Mainstream Acceptance: As more people and businesses adopt Bitcoin for transactions, holding, and investment, its value could increase exponentially. This “network effect” is a powerful driver of technology adoption and could lead to Bitcoin becoming a widely accepted global reserve asset.
Technological Development: While Bitcoin’s core blockchain is known for its stability, layers built on top of it, such as the Lightning Network, are designed to improve transaction speed and lower fees. These developments could increase Bitcoin’s utility as a medium of exchange, further boosting its value.
Potential Long-Term Price Targets
Due to the factors above, some analysts have put forward very ambitious long-term price targets, often looking to the next decade and beyond. These predictions are based on various models, including:
Stock-to-Flow Model: This model, though controversial, attempts to predict the price based on the scarcity of Bitcoin (its existing stock) relative to the rate at which new Bitcoin is produced (its flow).
Market Cap Comparison: Some models compare Bitcoin’s potential market capitalization to that of gold, major currencies, or other global asset classes. If Bitcoin were to capture even a fraction of the value of the global gold market, its price per coin would be in the hundreds of thousands of dollars.
For example, some analysts have publicly discussed targets in the range of $250,000 to over $1 million per Bitcoin in the coming years.
Important Caveats
It is crucial to understand that these are not guarantees. The future price of Bitcoin is subject to many risks, including:
Regulatory Crackdowns: Governments could impose strict regulations that hinder its adoption.
Competition from Other Cryptocurrencies: Other digital assets could emerge and compete for market share.
Technological Failures: A major security breach or vulnerability could undermine trust in the network.
Market Sentiment: Extreme volatility and sharp downturns remain a constant risk.
In conclusion, while no one can say for certain how high Bitcoin can go, the long-term bullish case rests on its unique combination of digital scarcity, growing institutional acceptance, and its potential role as a hedge against global financial instability. The price trajectory is likely to be a volatile ride, but proponents believe the foundational principles of the asset point to a potential for substantial long-term growth.
This article was generated with the help of AI and was reviewed by an editor
_____________
Technical Analysis is about trading with the trend
Note: This technical analysis is for educational purposes. Please conduct your own analysis or consult a financial advisor before making investment decisions. The author of this article may hold long or short positions in the featured stocks or indexes.
Maybe ok for a banking site but not a trading platform. There is no user interface to adjust the timeout. Also, the site can be unstable and reload as you are about to execute a trade.
Here is the AI feedback on Questrade timeouts:
The Questrade trading platform has different timeout behaviors depending on whether you are using the Web platform or the Edge Desktop software.
Here is the breakdown of the timeouts for each version:
1. Questrade Web (Browser)
Timeout Duration: Approximately 15 to 20 minutes of inactivity.
Customization: You cannot change this. It is a hard-coded security setting.
Behavior: If you do not click or interact with the page for roughly 20 minutes, you will be automatically logged out and forced to re-enter your password and 2FA code.
Workaround: There is no official setting to extend this. Active traders generally avoid the web platform for this reason.
2. Questrade Edge Desktop (Downloadable Program)
Timeout Duration: Indefinite (up to 24 hours).
Behavior: This platform is designed for active traders. As long as the application remains open and your computer does not go to sleep, you will stay logged in for the entire trading day (including pre-market and post-market).
Requirement: You must disable your computer’s “Sleep” mode to ensure the connection isn’t severed, which would force a logout.
3. Questrade Mobile App
Timeout Duration: Short (often 5–10 minutes of background activity).
Behavior: If you minimize the app or lock your screen, it will usually require you to re-authenticate when you reopen it.
Best Practice: Enable Biometric Login (Face ID or Fingerprint) in the app settings. This doesn’t stop the timeout, but it makes logging back in instant.
Summary
If you need to keep the platform open on a second monitor all day without being logged out, you must download and use the Questrade Edge Desktop version. The web browser version will consistently log you out for security reasons.
Technical Analysis is about trading with the trend
Note: This technical analysis is for educational purposes. Please conduct your own analysis or consult a financial advisor before making investment decisions. The author of this article may hold long or short positions in the featured stocks or indexes.
We use cookies to ensure that we give you the best experience on our website. If you continue to use this site we will assume that you are happy with it.